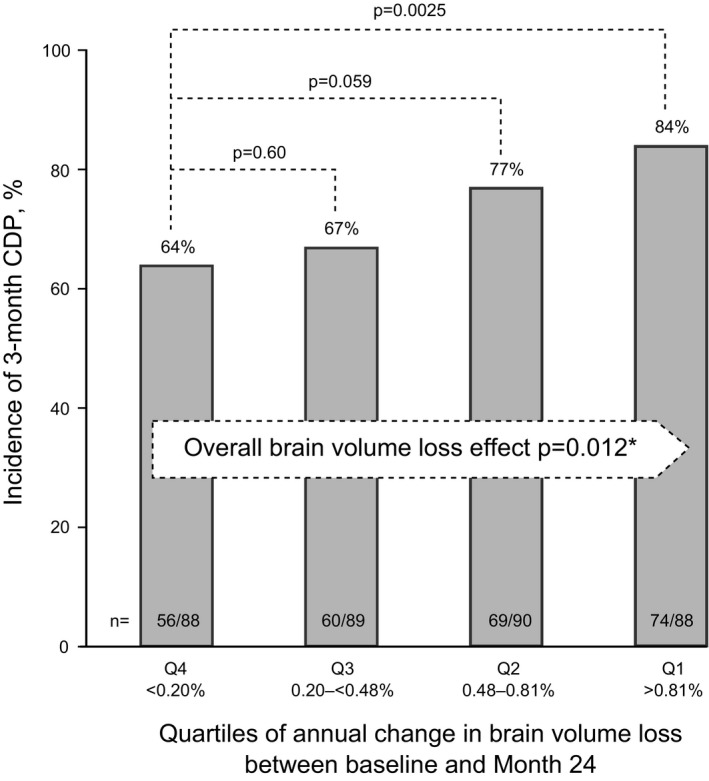
Figure 4.

Correlation between on‐study brain volume loss and on‐study disability worsening in the placebo population. Brain volume loss quartiles were derived from the Month 24 scan. Pairwise P values were obtained from a chi‐square test based on a logistic regression model with the brain volume loss category as the only factor. *The P‐value for “brain‐volume‐loss effect” is a type‐3 test from a logistic regression model with brain volume loss as the only explanatory factor; a significant P‐value indicates association between brain volume loss and the risk of disability progression. Q, quartile.
