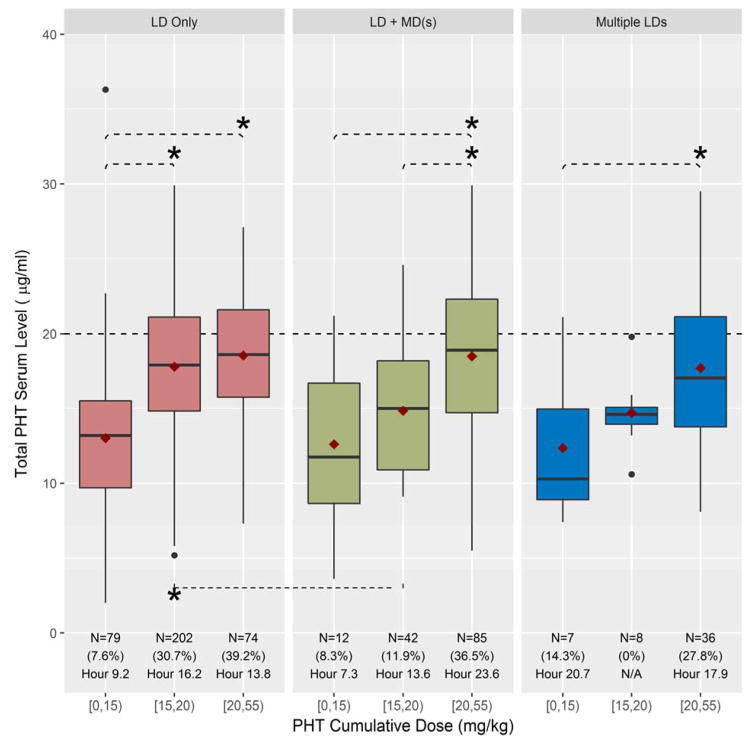
Figure 1. Cumulative weight adjusted Phenytoin (PHT)/Fosphenytoin (FOS) dose vs. Total PHT (tPHT) serum level obtained between 2 and 24 hours post initial loading dose.
Please use color in publication. Boxplots demonstrate the relationship between cumulative weight-based PHT/FOS dose and tPHT serum for each of the 3 medication regimen groups. X axis: weight-based ranges of cumulative dose of PHT/FOS in mg/kg ([3–15), [15–20), or [20–55)) prior to level drawn. Y axis: total PHT serum level in μg/mL. Red boxes: group receiving a single loading dose (LD Only). Green boxes: group receiving a single loading dose followed by at least one maintenance dose (LD+MD(s)). Blue boxes: group receiving multiple loading doses (Multiple LDs). The red diamond is the mean and black bar is the median tPHT serum level for each subgroup. Below each boxplot is the total number of serum tPHT levels (N) for each subgroup, the percent of levels ≥ 20 μg/mL (%) and the last hour post the loading dose administration when tPHT level ≥20 μg/mL was present. Asterisks (*) indicate p<0.05 for Tukey’s test of differences.

