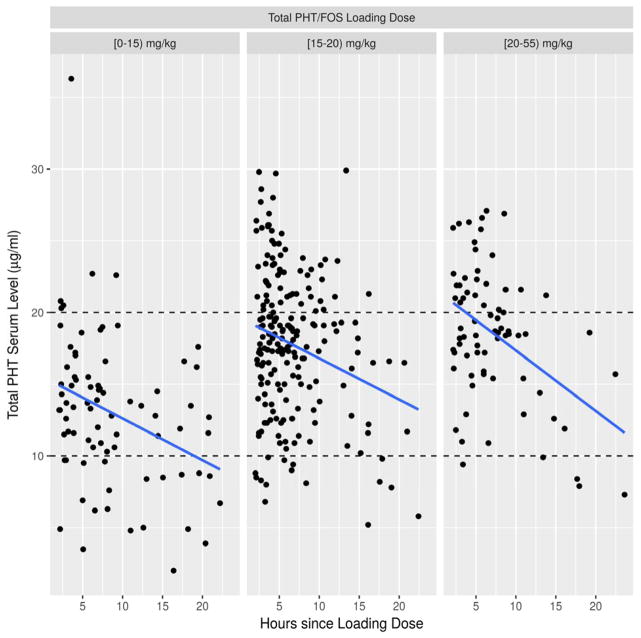
Figure 2. Total PHT (tPHT) serum levels obtained two to 24 hours in a group receiving a single Phenytoin (PHT)/Fosphenytoin (FOS) loading dose.
The weight-based loading dose is divided into [3–15), [15–20), or [20–51) mg/kg subgroups. X axis: hours since loading dose. Y axis: total PHT serum level (μg/ml). Blue lines represent linear model fit.

