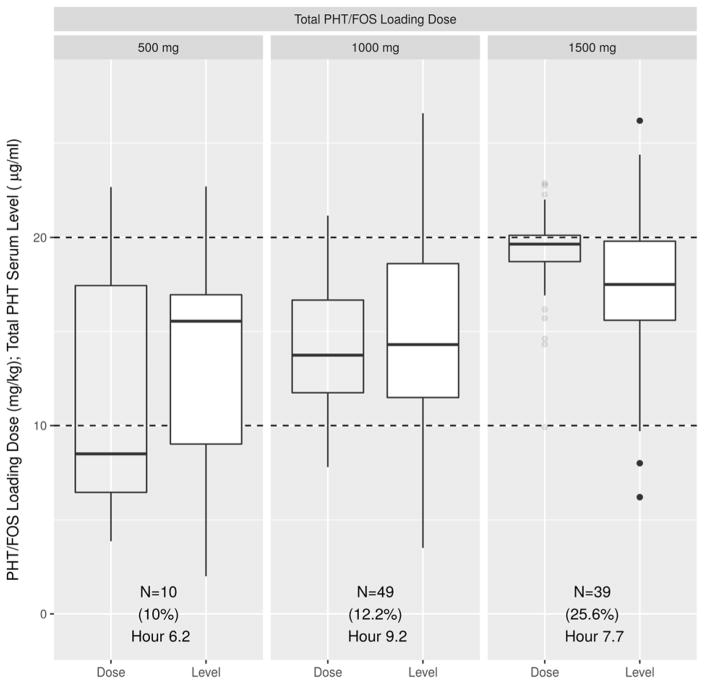
Figure 3. Preset loading dose of 500, 1000 or 1500 mg/PE converted to weight-based value and correlated with subsequent total phenytoin serum levels obtained between 2 and 24 hours post infusion.
The clear boxplots represent Phenytoin weight-based loading doses (mg/kg for each of the present loading dose value). The white boxplots represent the corresponding serum tPHT levels (μg/mL) obtained between 2 and 24 hours post infusion. Below each boxplot is the total number of values in each subgroup (N), the percent of tPHT serum levels ≥ 20 μg/mL (%) and the last hour when tPHT level of ≥ 20 μg/mL was recorded.

