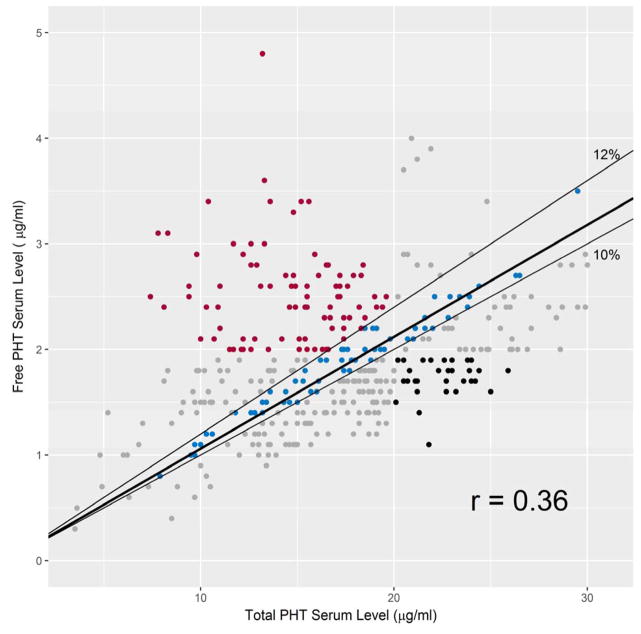
Figure 4. Correlation between free and total concomitant Phenytoin (PHT) serum levels.
Color should be used in print.
X axis: total PHT serum level (μg/mL). Y axis: free PHT serum level (μg/mL). The thin black lines border free to total PHT serum level ratios of 10% and 12%. The thick black line is the linear model fit to the data. The data points colored blue if the ratio of free to total PHT level is within 10–12%; red with frPHT level > 2 μg/mL and tPHT level < 20 μg/mL; black if frPHT < 2 μg/mL and tPHT level ≥ 20μg/mL.

