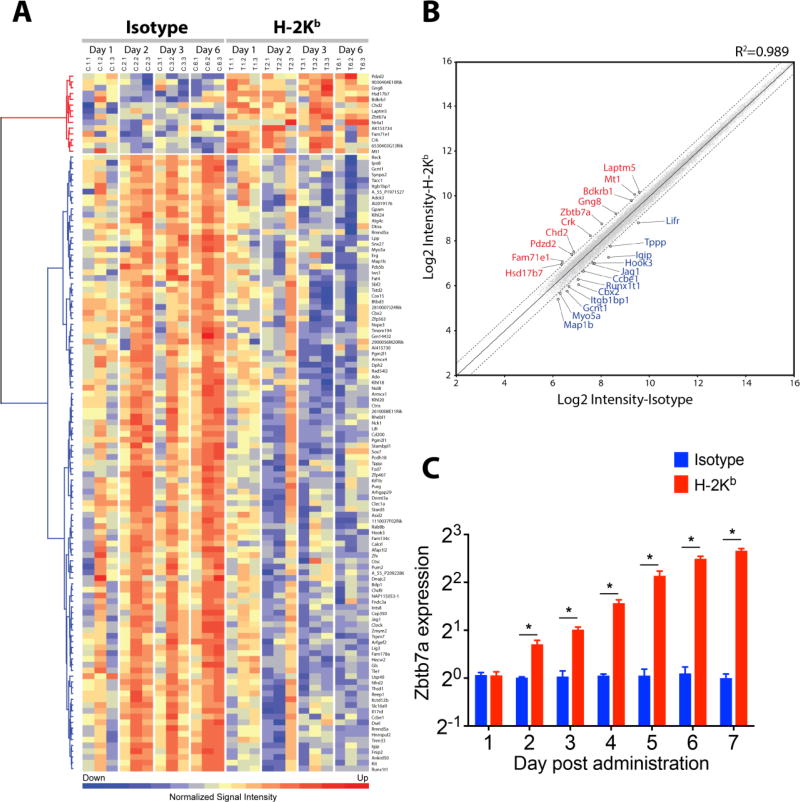
Fig. 1. Profile of the lung transcriptome following MHC class I ligation by specific Ab.
(A) Heat map presentation of the differentially expressed genes following intrabronchial administration of H-2Kb or isotype control into C57BL/6 mice analyzed by mouse 4×44K mouse V2 chips (Agilent). Three mice per group per day were analyzed and plotted. Probe intensity was normalized by z-score, and red and blue color coding indicate higher and lower expression levels, respectively. Data have been deposited into the NCBI GEO database (GEO ID: GSE71426). (B) Scatterplot highlighting 23 selected genes differentially expressed between H-2Kb and isotype control groups. Mean signal intensities were transformed into Log2, and quantile normalization was applied. Differential expression was determined by two-way ANOVA test, and expression level exceeding 1.5 fold, p<0.05 and FDR q<0.1 was deemed significant. The central solid line represents line of equality and genes expressed >1.5 fold demarcated by dashed lines are annotated (red: upregulated, blue: downregulated). (C) Quantitative PCR validation of Zbtb7a expression was conducted in a parallel experiment. Five mice per time point were analyzed for Zbtb7a expression (IDT assay id, Mm.PT.58.29517580) and normalized with that of Actb (IDT, Mm.PT.58.33540333). Zbtb7a expression in untreated C57BL/6 lungs was set as baseline expression. Data are presented as mean±SEM, multiple t-test applied with multiple comparisons by Holm-Sidak method and p<0.05 is considered significant (*).

