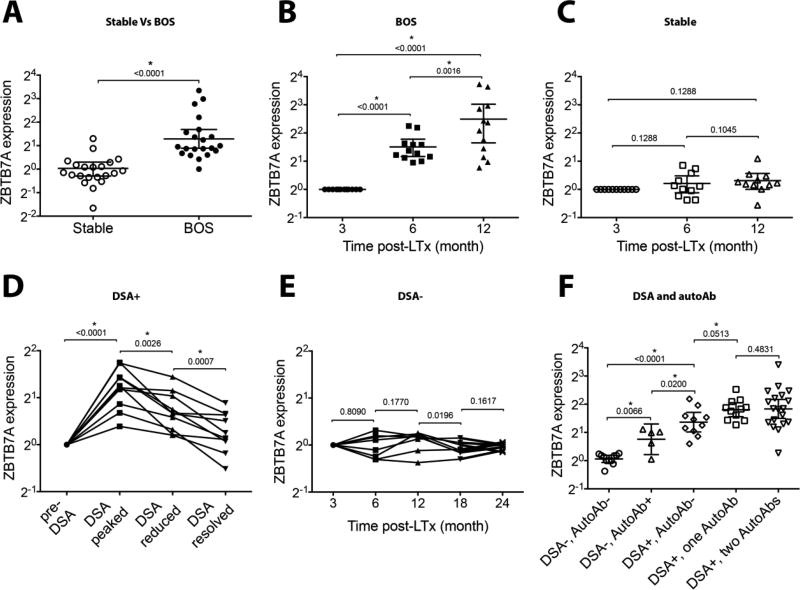
Fig. 3. Early induction of ZBTB7A in LTxRs who developed de novo DSA and BOS.
BAL cell ZBTB7A expression was evaluated by quantitative PCR after normalization with ACTB, CD68, and PPARG (91). Delta Ct values at 3 months post-LTx were set as baseline for respective LTxRs (sTable 2), and relative expression for subsequent time points was calculated as 2−ΔΔCt. (A) ZBTB7A induction in a cohort of 21 BOS+ LTxRs and time-matched 21 LTxRs who remained BOS-free, (B) kinetic study at 6±1 and 12±1 post-LTx months on 12 LTxRs who later developed BOS and (C) 11 LTxRs who remained stable were evaluated. (D) Ten LTxRs who developed de novo DSA (MFI >2000) and received Ab-directed therapies were stratified as pre-DSA (MFI<2000), DSA-peaked (highest MFI observed during follow-up of individual patient), DSA-reduced (2000<MFI<Peak), and DSA-resolved (MFI<2000). (E) Serial samples from eight stable LTxRs (DSA− and not treated by Ab-directed therapies) were evaluated. (F) Role of DSA and autoAb (anti-Kα1T, anti-Col V) in ZBTB7A induction evaluated in LTxRs DSA−autoAb− (n=11); DSA−autoAb+ (either anti-Kα1T or anti-Col V, n=5); DSA+autoAb− (n=10); DSA+one autoAb (either anti-Kα1T or anti-Col V, n=11) and DSA+two autoAbs (anti-Kα1T and anti-Col V, n=19). Two-tailed Mann-Whitney U test was applied and p values are indicated. Significance of the results is marked at p<0.05 (*).

