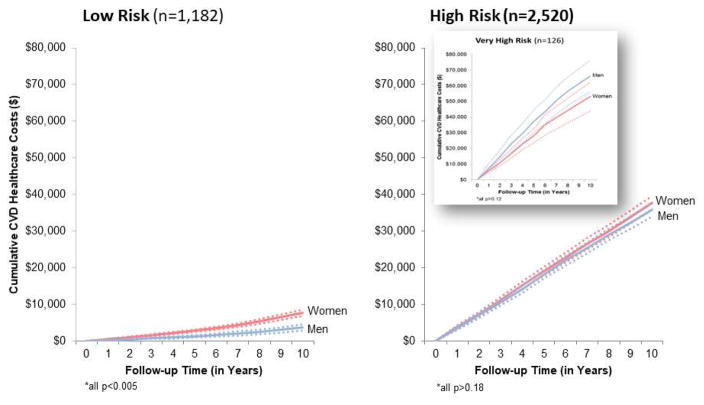
Figure 3. Cumulative Follow-Up CVD Health Care Costs Among MESA Subjects with Low- and High-Risk Findings.
Cumulative (unadjusted) follow-up CVD health care costs (with 95% confidence intervals, dotted lines) are shown for low-risk (n = 1,182 with low-risk FRS, CACS = 0, and normal glucose values) and high-risk findings (n = 2,520 with CACS ≥400, diabetes, or high-risk FRS). A subset of very high-risk subjects, defined as diabetic patients with a high-risk FRS and CACS ≥400 (n = 126) is plotted as an insert. Abbreviations as in Figures 1 and 2.

