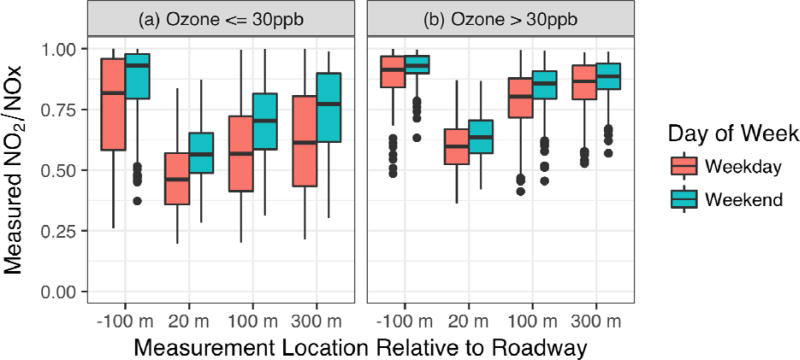
Fig. 3.
Measured NO2/NOX ratios at each measurement location during the Las Vegas field study for all hours; (a) left-hand panel contains only hours where the measured O3 at the Paul Meyer monitoring site is ≤ 30 ppb, and (b) right-hand panel contains only hours where measured O3 at the Paul Meyer monitoring site is > 30 ppb. Values are differentiated by weekday vs. weekend. The box represents the middle 50% of the data, extending from the 25th to the 75th percentiles; the horizontal line through the center of the box is the median; the whiskers represent 1.5*IQR (the inter-Quartile Range, the range from the 25th to 75th percentiles); the points are outliers beyond 1.5*IQR. Data presented are in subset with winds from the west and in Q3.

