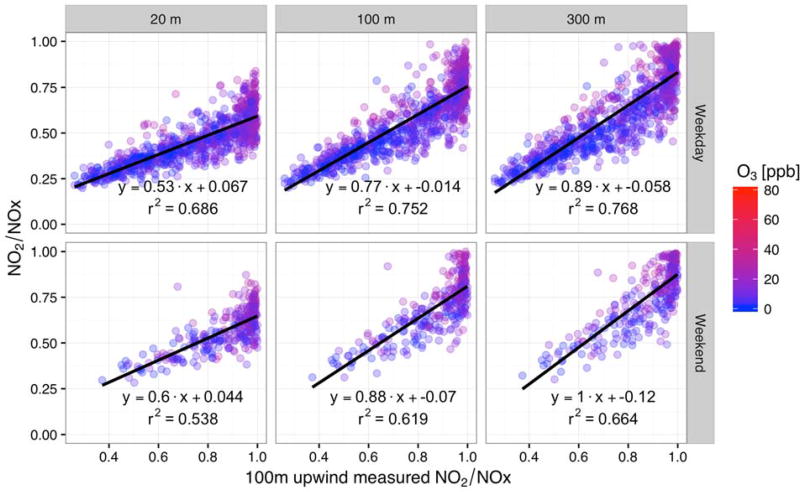
Fig. 5.
NO2/NOX ratio as a function of NO2/NOx as measured at the 100 m upwind site when winds are from the west and in Q3, colors are based on the O3 concentration, where only low O3 (≤ 30 ppb) conditions are shown; top row are weekdays, bottom row are weekends; Left-hand column shows the 20 m measurement site, center column shows the 100 m measurement site, and the right-hand columns shows the 300 m measurement site.

