Figure 2.

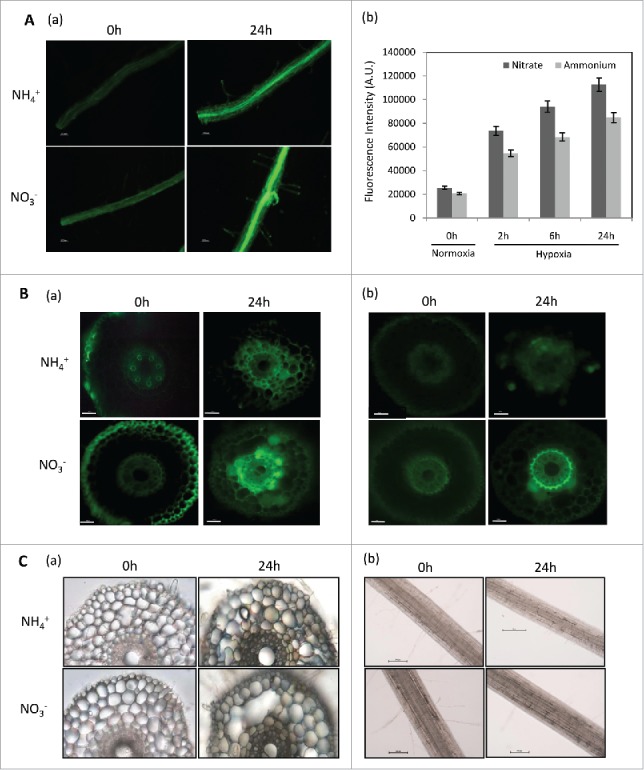
ROS, NO production and superoxide levels in wheat cross-sections and root segments. (A) Total ROS levels in wheat roots grown in NO3− and NH4+ measured by dichlorodihydro-fluorescein diacetate (H2-DCF-DA) by determining production of dichlorofluorescein (DCF) (n = 5). Roots were incubated in 10 µM dichlorodihydro-fluorescein diacetate (H2DCF-DA), 10 mM Tris-HCl buffer, pH-7.2 for 5 minutes in dark, and then washed with buffer three times. Images were recorded with fluorescence microscope (Nikon80i, Japan) at 495 nm excitation and 515 nm emission wavelength; (a) DCF fluorescence in root segments grown in nitrate and ammonium under normoxia and hypoxia-24 h; (b) DCF fluorescence intensities measured by ImageJ in root segments grown in nitrate and ammonium nutrition under normoxia and hypoxia-24 h. Values are (n = 5 ± SE). Scale bar = 250 µm. (B) ROS and NO production in root cross-sections measured by H2DCF-DA and DAF-FM-DA respectively (a) DCF fluorescence in root cross-sections (n = 5) grown in nitrate and ammonium nutrition under normoxia and hypoxia-24 h; (b) DAF-FM fluorescence in root cross-sections (n = 5) grown in nitrate and ammonium nutrition under normoxia and hypoxia-24 h. Scale bar = 250 µm. (C) Aerenchyma development and superoxide (O2−•) production in wheat roots (n = 3) grown in nitrate and ammonium nutrition measured by in vivo staining with nitroblue tetrazolium chloride; NBT as a substrate by measuring the formation of formazan complex. The roots were visualized and photographed under bright field microscope (Nikon 80i, Japan) for the presence of dark blue-violet spots (formazan precipitates); (a) Localization of O2−• in root cross-sections under normoxia and hypoxia-24 h; (b) Localization of O2−• in root segments under normoxia and hypoxia-24 h. Scale bar = 250 µm.
