
Figure 2.
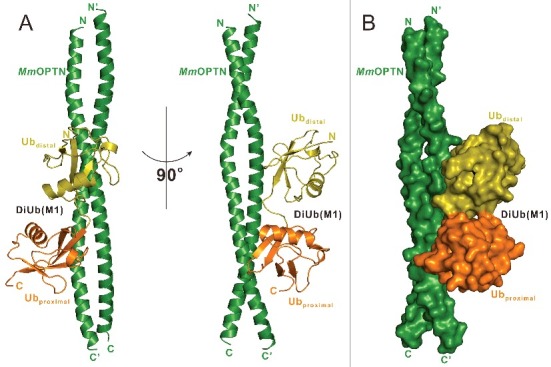
Overall structure of MmOPTN(417 to 512) in complex with the DiUb(M1). (A) Ribbon diagram showing the overall structure of MmOPTN(417-512)-DiUb(M1) complex. In this drawing, MmOPTN(417 to 512) is shown in forest green, distal- and proximal- ubiquitin of DiUb(M1) in olive and orange, respectively. (B) The surface representation showing the overall architecture of MmOPTN(417 to 512)-DiUb(M1) complex with the same color plan as in panel (A).