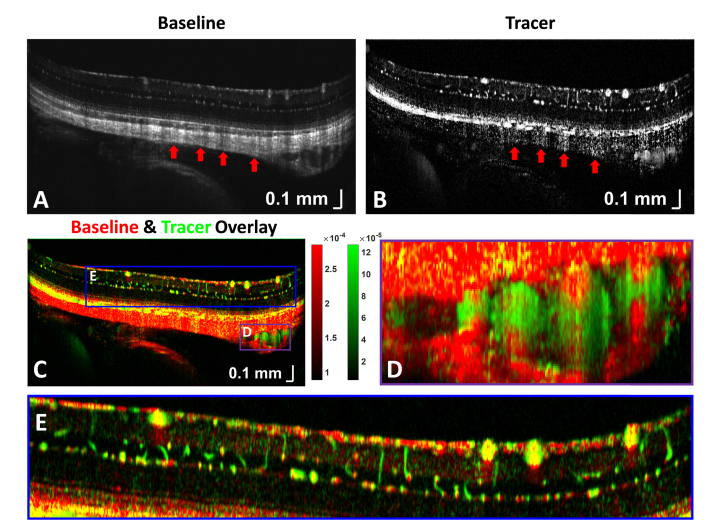
Fig. 5.
(A) Baseline OCT angiogram, showing RBC backscattering in the posterior pole of an unpigmented Sprague-Dawley rat. (B) Tracer signal during bolus passage. (C) Color overlay of (A) and (B), where red represents RBC signal, green represents tracer signal, and yellow includes both. Regions with large enhancement factors [Eq. (1)] are green, while regions with small enhancement factors are red. (D) The long posterior ciliary vessels seen within the sclera also demonstrate a prominent hourglass pattern. (E) Zoom of the inner retinal vasculature shows that vertical capillaries and retinal vessel sides are greener (tracer signal weighted), horizontal capillaries and retinal vessel tops are more yellow and red, and retinal vessel tails are purely red (RBC signal weighted).

