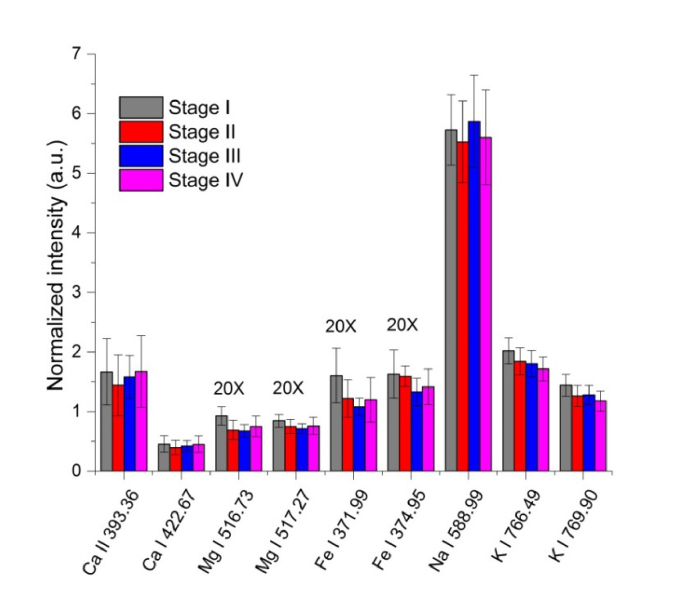
Fig. 5.
Correlation of the normalized intensities of several LIBS emission lines of the whole blood samples of the lymphoma class with the cancer progression stages. The shown intensities of Mg I 516.73 nm, Mg I 517.27 nm, Fe I 371.99 nm and Fe I 374.95 nm are multiplied by 20 folds. The error bars are the standard deviations of the intensities of independent spectra.

