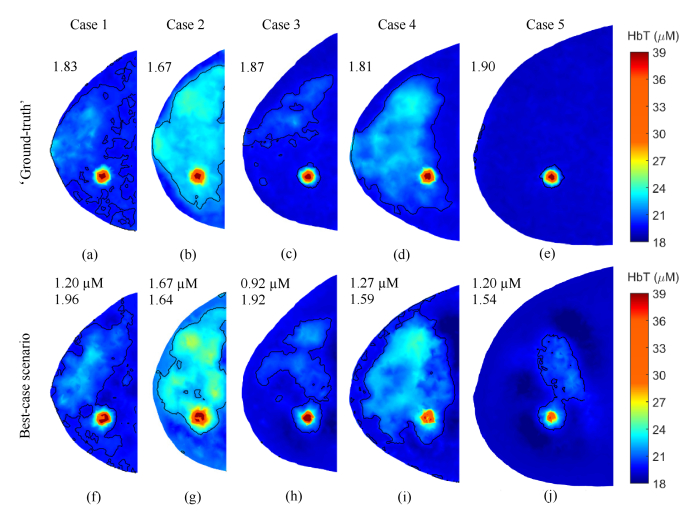
Fig. 3.
(a-e) ‘Ground-truth’ reference HbT images, and (f-j) HbT images recovered using three-composition-prior under the best-case scenarios for all five cases. Black contour lines mark out regions where HbT > 20 µM in all cases except Case 2, the densest case, where HbT > 22 µM were used to draw the contour line. RMSE of HbT and tumor contrast R are shown in the upper left corner of each plot (R only for ground truth). All images are extracted from the z-slice that crosses the lesion center.

