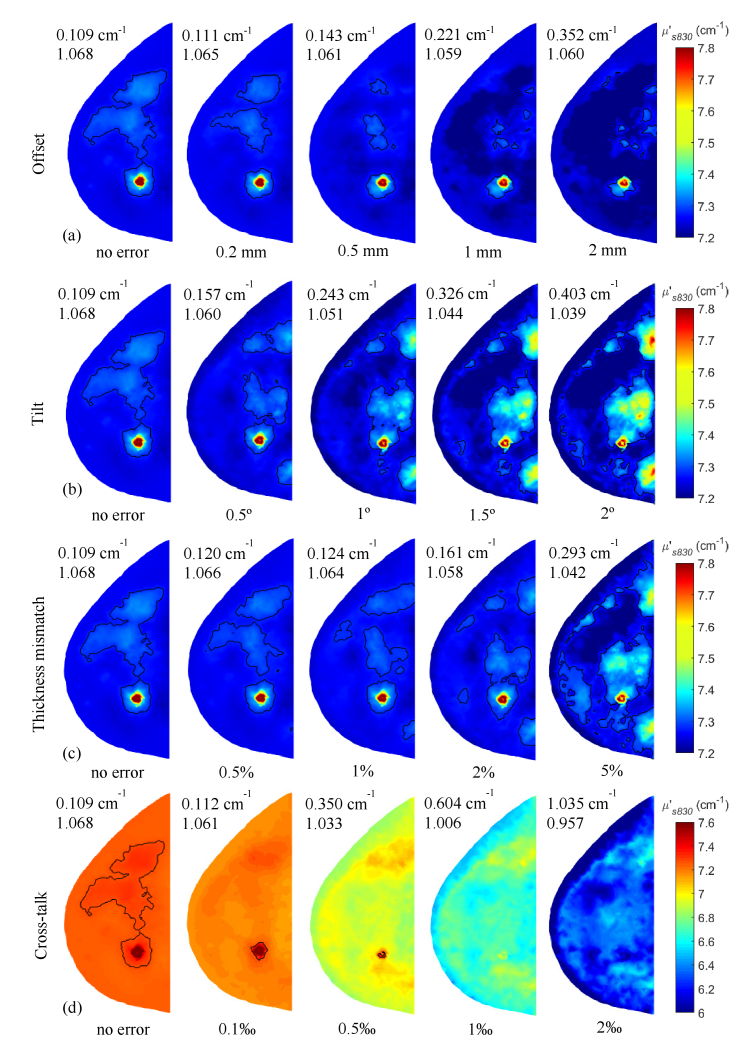
Fig. 5.
Images of reduced scattering coefficients at 830 nm (µs'830) recovered using three-composition-prior for Case 3 under the same four experimental errors as shown in Fig. 4. Rows from top to bottom represent error types of (a) translational offset along the x-axis, (b) source plate N-C tilt, (c) breast thickness mismatch, and (d) cross-talk between signal channels. All images are extracted from the z-slice that crosses the lesion center. Black contour lines circle out regions where µs'830 > 7.28 cm−1 to help visualize progressive changes caused by experimental errors. RMSE of µs'830 and recovered tumor contrast in µs'830 are shown in the upper left corner of each plot.

