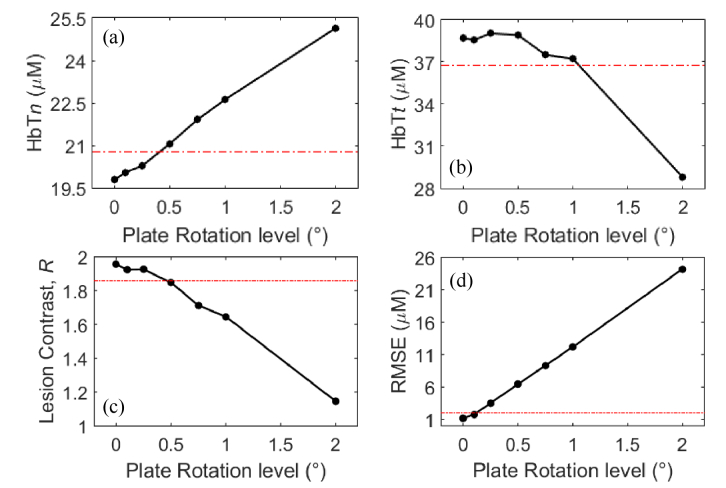
Fig. 6.
Scatter plots of (a) mean HbT in surrounding normal tissue area, HbTn, (b) mean HbT in the lesion ROI, HbTt, (c) lesion contrast, R, and (d) overall RMSE of HbT, versus source plate rotation levels in Case 1. Red dot-dashed lines in (a-c) represents thresholds that equal to 5% deviation from the best-case scenario values (rotation level = 0), and that in (d) represents RMSE = 2 µM.

