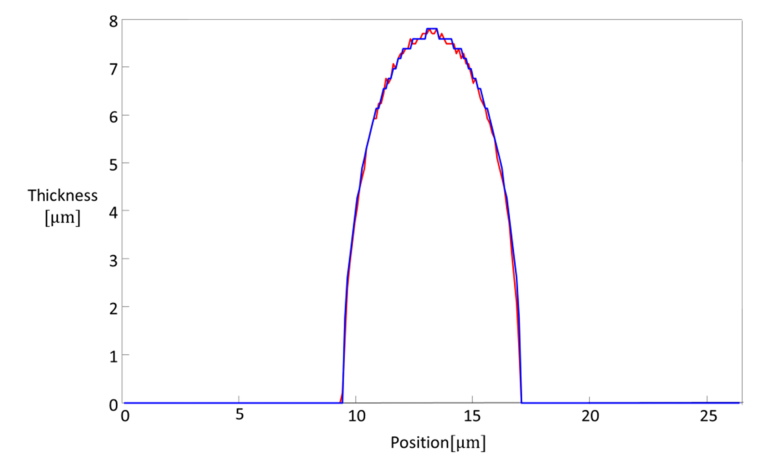
Fig. 2.
Assessment of error due to assuming tilted versus untitled ellipsoid as the nucleus model. Red curve: cross section through the center of the thickness distribution of an ellipsoid tilted in relative to the z axis, as shown schematically in Fig. 1(a). Blue curve: cross section through the center of the thickness distribution of an ellipsoid with axes aligned relative to the Cartesian coordinate system, as shown schematically in Fig. 1(b). Both ellipsoids have identical and .

