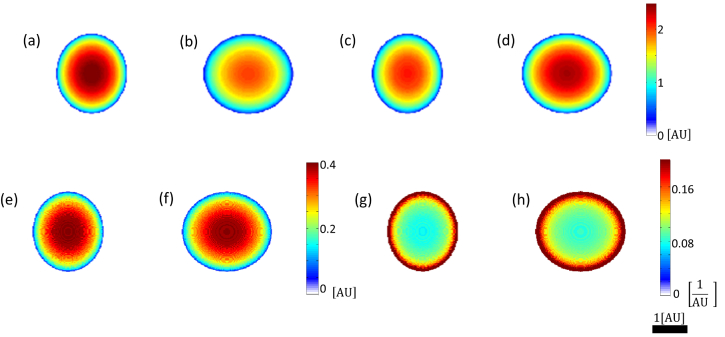
Fig. 5.
Thickness distribution for worst orientation scenarios in using ellipsoid model, for a normalized representative cell nucleus. (a,c,e,g) Case 1, corresponding to the first row in Table 2. (b,d,f,h) Case 2, corresponding to the second row in Table 2. (a,b) True thickness distribution. (c,d) Evaluated thickness distribution. (e,f) Absolute value of error in thickness evaluation. (g,h) Absolute value of error in inverse thickness evaluation.

