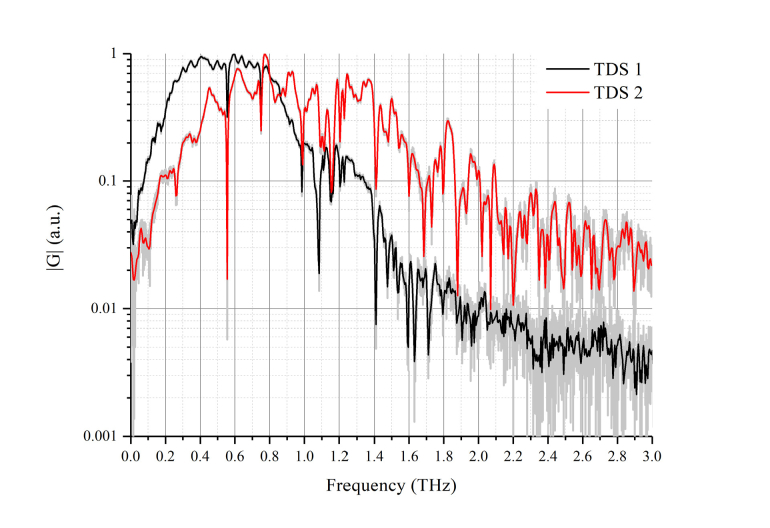
Fig. 3.
Reference THz signals in frequency-domain (setup TDS 1 with InAs generator – black line, setup TDS 2 with Mg:LiNbO3 generator – red line). Water vapor absorption lines are clearly seen at frequencies 0.56, 0.75, 0.99, 1.12, 1.17, 1.41 THz at both signals. Spectral amplitudes |G| are different due to different humidity at the measurement rooms. Range from 0.2 to 1.1 THz has high power spectral density |G| and low noise for both setups.

