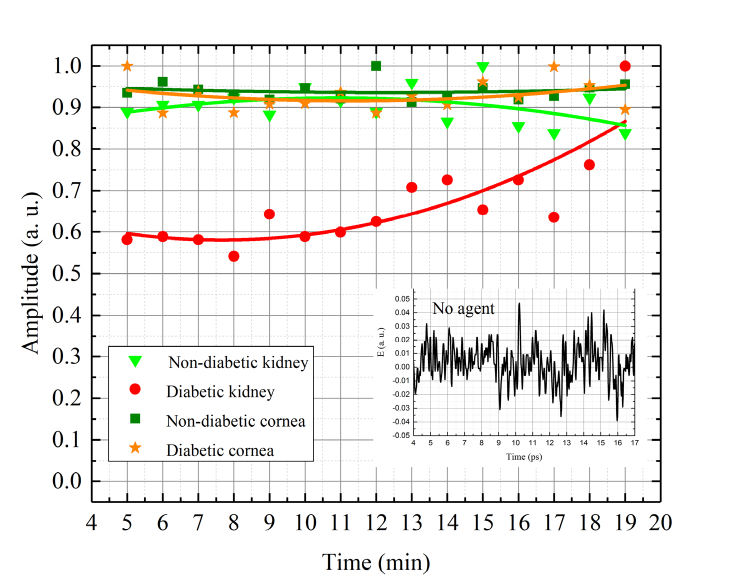
Fig. 7.
Kinetics of the transmitted signal of the rat diabetic and non-diabetic kidney and cornea tissues treated with glycerol (70%) at the maximum of THz pulse. The inset figure corresponds to the THz signal passed through the sample not to have been treated with glycerol (diabetic and non-diabetic kidney and cornea samples). Each symbol on the graph are the experimental measured data, lines are fitting curves.

