Fig. 3.
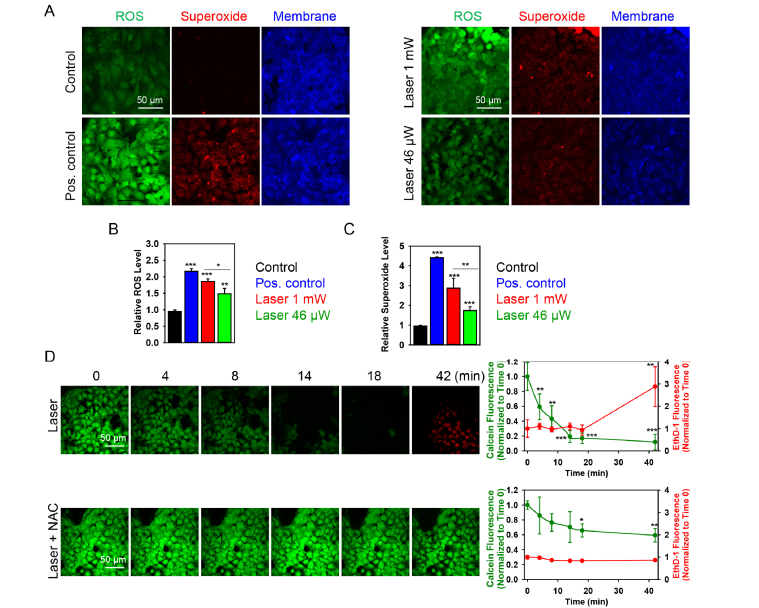
Dose-dependent ROS induction by laser irradiation. (A) Cells were labeled with the ROS-sensitive fluorescent dyes using the cellular ROS/Superoxide detection kit (Abcam, Cambridge, United Kingdom). Cell membranes were labeled with CellMask. Non-irradiated cells with no chemical treatment served as a negative control (left panel). Non-irradiated cells treated with Pyocyanin (200 μM) were used as a ROS positive control (left panel). Cells irradiated by laser fluences of 1 mW and 46 µW are shown on the right panel. All fluorescence images were acquired by confocal microscopy. (B) Quantitative analysis of relative ROS fluorescence emission intensity from cells treated by laser. ImageJ software (NIH) was used for image processing and quantification. Data are expressed as means ± SEM (n = 3), *P< 0.05 **P< 0.01 ***P< 0.001. (C) Quantitative analysis of relative superoxide fluorescence emission intensity from cells treated by laser. ImageJ software (NIH) was used for image processing and quantification. Data are expressed as means ± SEM (n = 3), *P< 0.05 **P< 0.01 ***P< 0.001. (D) ROS scavenger N-acetyl-L-cysteine (NAC) reduces the cytotoxicity induced by laser. Viability of Huh7 cells exposed to the laser for indicated time periods with supplementation of 5 mM NAC was detected by the Thermo Fisher Scientific fluorescent live/dead cell assay kit. Cells were imaged and analyzed as in Fig. 2. Data are expressed as means ± SEM (n = 3), t = 0 time point served as control, *P< 0.05 **P< 0.01 ***P< 0.001.

