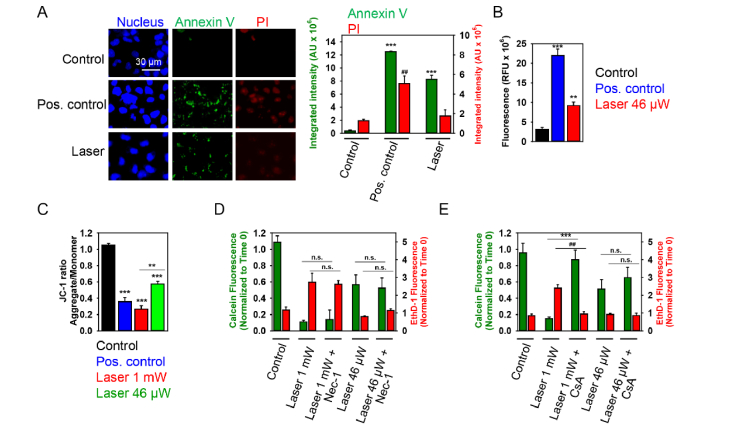
Fig. 5.
Low dose laser irradiation induces apoptotic cell death of Huh7 cells. (A) Cells were treated with low dose (46 µW) laser irradiation for 40 min and then labeled with NucRed nuclear stain (blue), annexin V (green) and PI (red). Cells treated with 2 μM staurosporine for 3 h served as a positive control. Labeled cells were imaged with fluorescence microscopy. Representative images out of three independent experiments are shown. Annexin V and PI fluorescence intensities were analyzed with ImageJ. Data are expressed as means ± SEM (n = 3), ***P< 0.001, ##P< 0.01. (B) Cells were treated with low dose (46 µW) laser irradiation for 40 min and then incubated with caspase-3 inhibitor VAD-FMK conjugated to FITC (FITC-VAD-FMK). Following the staining, cells were analyzed using a fluorescent microscope. Fluorescence intensities were analyzed with ImageJ. Data are expressed as means ± SEM (n = 3), **P< 0.01 ***P< 0.001. (C) Cells were treated with low dose (46 µW) laser for 40 min then stained with 2 μM JC-1 for 30 min and then analyzed by confocal microscopy. As a positive control, cells were treated with 10% ethanol for 10 min. ImageJ software (NIH) was used for image processing and quantification. Data are expressed as means ± SEM (n = 3), **P< 0.01 ***P< 0.001. (D) Viability of Huh7 cells exposed to the laser light with supplementation of 10 µM Nec-1 (1 h pre-treatment with Nec-1 followed by 40 min laser irradiation) was detected by the Thermo Fisher Scientific fluorescent live/dead cell assay kit. Cells were imaged and analyzed as in Fig. 2. Data are expressed as means ± SEM (n = 3). (E) Viability of cells exposed to the laser light with supplementation of 20 µM CsA (1 h pre-treatment with Cs-A followed by 40 min laser irradiation) was detected as in (D). Cells were imaged and analyzed as in Fig. 2. Data are expressed as means ± SEM (n = 3), ##P< 0.01 ***P< 0.001.

