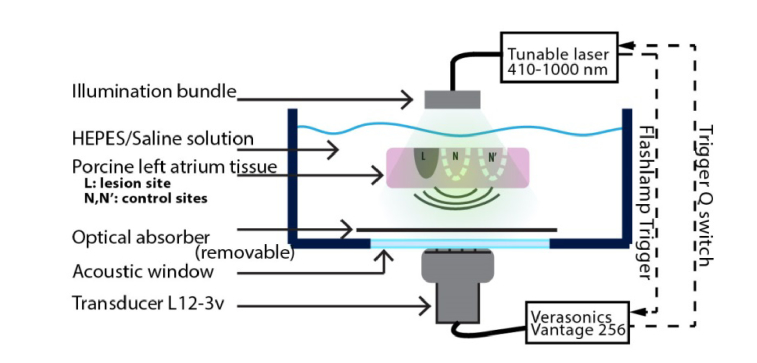
Fig. 1.
Transmission PA imaging setup for spectroscopic analysis of RF ablation lesions. The tissue is suspended and stretched with the aid of wires. A fiber bundle illuminates the atrium sample from the endocardial side. A 192 element 7.8 MHz center frequency transducer records the generated PA signal. A black plastic sheet (optical absorber) provides a reference signal to assess optical attenuation. We analyze spectroscopic differences in PA response in lesion (L) and control (N,N’) sites.

