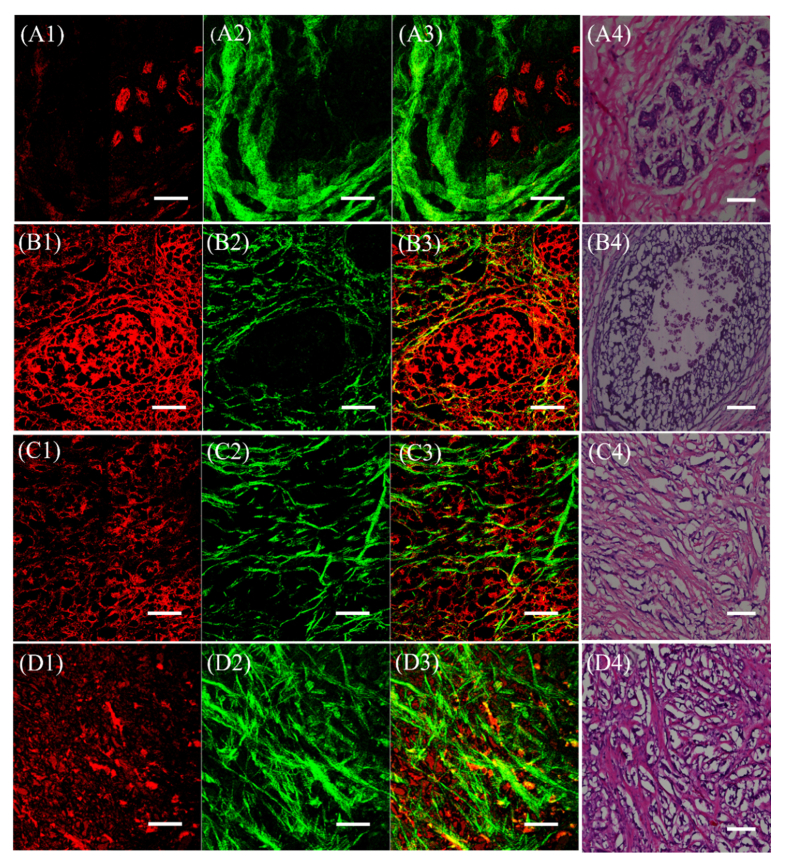
Fig. 1.
TPM images and histological images of the structures of breast tissues in four samples status. The first column (A1, B1, C1, and D1) was obtained by AF, which reflects endogenous fluorophore. The second column (A2, B2, C2, and D2) was obtained by the second harmonic generated, which reflects the collagen. The third column (A3, B3, C3, and D3) combines AF and SHG. The fourth column (A4, B4, C4, and D4) is the corresponding H&E stained images. (A1) -(A4) Normal breast, (B1) -(B4) Ductal carcinoma in situ, (C1) -(C4) Invasive ductal carcinoma, and (D1) -(D4) Invasive ductal carcinoma post-chemotherapy. The scale bar is 100 µm.

