
Figure 4.
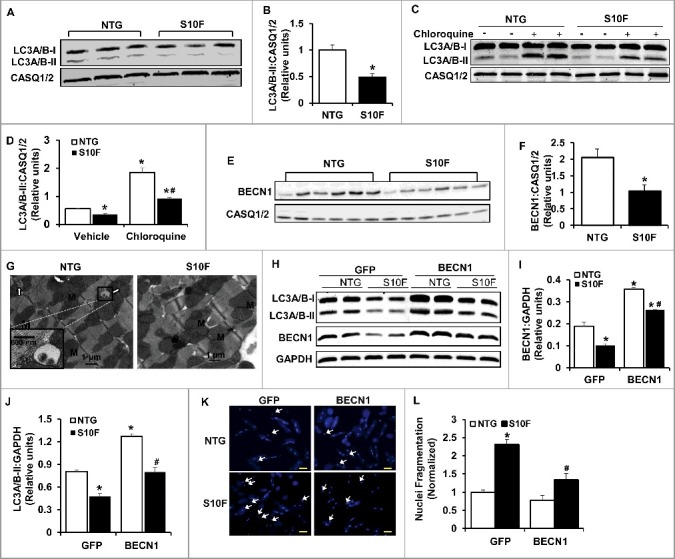
Impaired autophagy activity is associated with reduced BECN1 protein levels in HSPB6S10F hearts. (A), Representative immunoblots of LC3A/B-I and LC3A/B-II using calsequestrin (CASQ1/2) as a loading control; (B), Quantitative analysis of LC3A/B-II; n = 4 hearts for NTG and 4 hearts for HSPB6S10F; (C and D), Autophagy flux: (C), Western blots of LC3A/B-I and LC3A/B-II, as well as CASQ1/2 in mice that were i.p. injected with chloroquine (CQ, 50 mg/kg) or sterile saline (Vehicle) for 4 h before sacrifice; (D), Autophagic flux data that were analyzed and expressed as mean ± SEM. *: P < 0.05, vs NTG-Vehicle; #: P < 0.05, vs. NTG-Chloroquine; n = 6 hearts for each group; (E), Representative immunoblots of BECN1 and CASQ1/2; (F), Quantitative analysis of protein levels of BECN1; n = 6 hearts for NTG, and 6 hearts for HSPB6S10F; Values represent means ± SEM; *: P < 0.05, vs NTG; (G), Electron microscopy revealed impaired autophagy in HSPB6S10F heart tissue. White arrows denote typical autophagosomes; (H), Representative immunoblots of LC3A/B-I, LC3A/B-II, BECN1 and glyceraldehyde-3-phosphate dehydrogenase (GAPDH); (I and J), Quantitative analysis of protein levels of BECN1 and LC3A/B-II; n = 6 hearts for each group; Values represent means ± SEM; *: P < 0.05, vs GFP-NTG; #: P < 0.05, vs BECN1-NTG; (K), Representative images of cardiomyocyte apoptosis by Hoechst staining in each group. The apoptotic cells were indicated by the arrows, scale bars = 50 μm; (L), Normalized percentage of apoptotic cells per total number of cardiac cells in each group. n = 4 hearts for NTG and 4 hearts for HSPB6S10F. Values represent means ± SEM; *: P < 0.05, vs GFP-NTG; #: P < 0.05, vs GFP-HSPB6S10F.