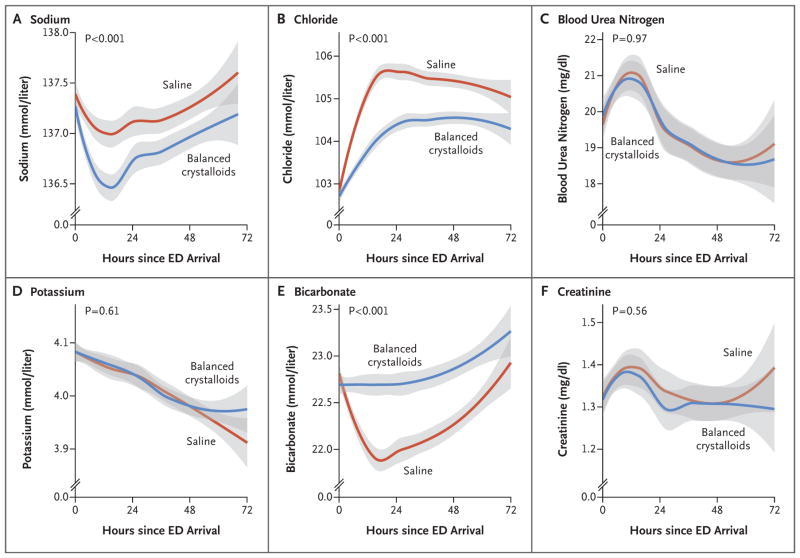
Figure 1. Serum Electrolyte Concentrations in the First 72 Hours after Arrival in the Emergency Department (ED).
Lines and bands represent means and 95% confidence intervals, respectively. Plots were generated with the use of locally weighted scatterplot smoothing. The P values in the figure represent the overall difference between groups, calculated with the use of proportional-odds models. Over time, the separation between groups increased for chloride (P<0.001 for interaction) and bicarbonate (P<0.001 for interaction); interaction terms for the other variables were not significant. To convert the values for blood urea nitrogen to millimoles per liter, multiply by 0.357. To convert the values for creatinine to micromoles per liter, multiply by 88.4.

