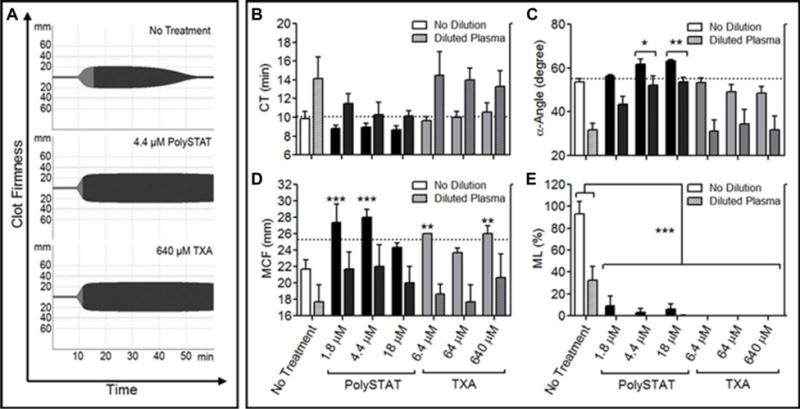
Figure 2.

Comparison of PolySTAT and rFVIIa in an sTIC plasma model. (A) Representative ROTEM traces of untreated sTIC controls, PolySTAT-treated sTIC plasma, and TXA-treated sTIC plasma without dilution are shown. (B) Clotting time, (C) α-Angle, (D) MCF, and (E) ML were measured. Data are averages ± SD of experiment completed in triplicate. P-values were determined using one-way ANOVA and Tukey post hoc test. *P < 0.05, **P < 0.01, ***P < 0.001 versus no treatment.
