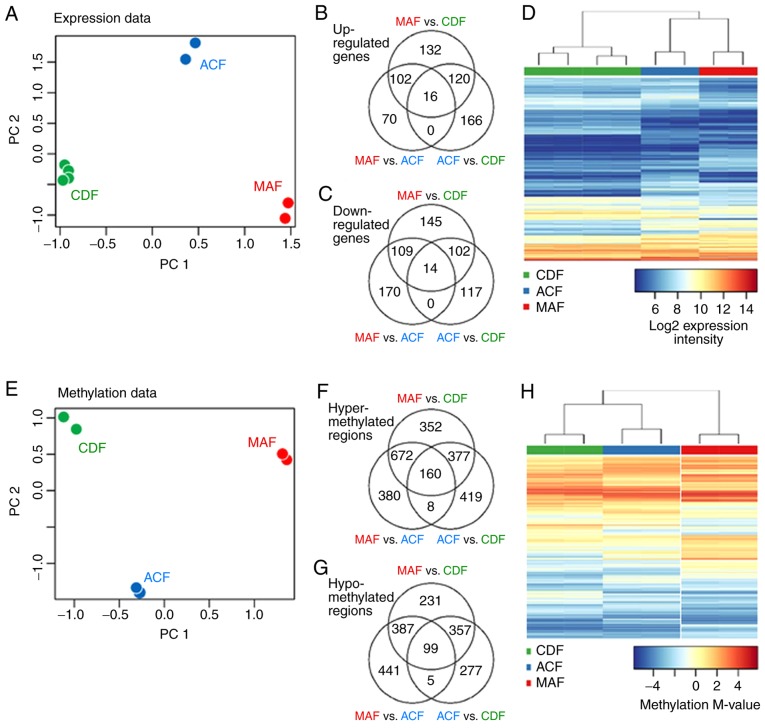
Figure 5.
MAFs, ACFs and CDFs differ profoundly both in their gene expression profiles and in their genome methylation profiles. (A) Projections of the expression data on the first two PCs, as determined by a PC analysis performed on expression profiles of all differentially expressed genes. PC1 reflects differences between MAF and CDF, with ACF being placed between the stromal and normal fibroblasts. (B and C) Venn diagrams display overlaps of upregulated and downregulated genes. (D) Heatmaps with a comparative analysis of MAF, ACF and CDF present a clear separation of the different fibroblast groups both in their expression profiles. (E) Projections of the methylation data on the first two PCs were plotted as determined by a PC analysis performed on methylation profiles of all differentially methylated genes. (F and G) Venn diagrams display overlaps of hyper-methylated and hypo-methylated regions in various studied comparisons. (H) MAF, ACF and CDF methylation profiles. Only differentially expressed genes and differentially methylated regions are presented. MAF, melanoma-associated fibroblast; ACF, autologous control fibroblast; CDF, control dermal fibroblast; PC, principal component.

