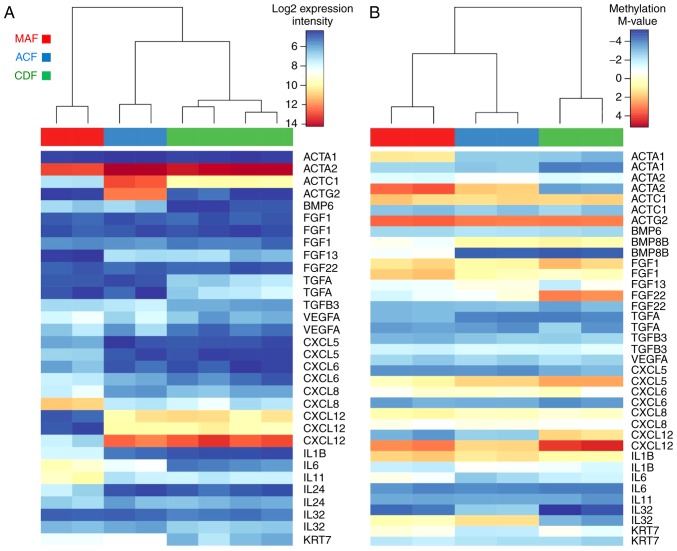
Figure 6.
Changes in gene expression and methylation of selected genes with the strongest changes in gene expression and methylation. For the selected genes, heatmaps of (A) gene expression and (B) methylation of genomic regions overlapping the genes loci are presented. Methylation is expressed in terms of M-values. M=−4 [(A) 0; (B) 4] corresponds to ~5% [(A) 50%; (B) 95%] of the DNA in the methylated genomic region. MAF, melanoma-associated fibroblast; ACF, autologous control fibroblast; CDF, control dermal fibroblast.

