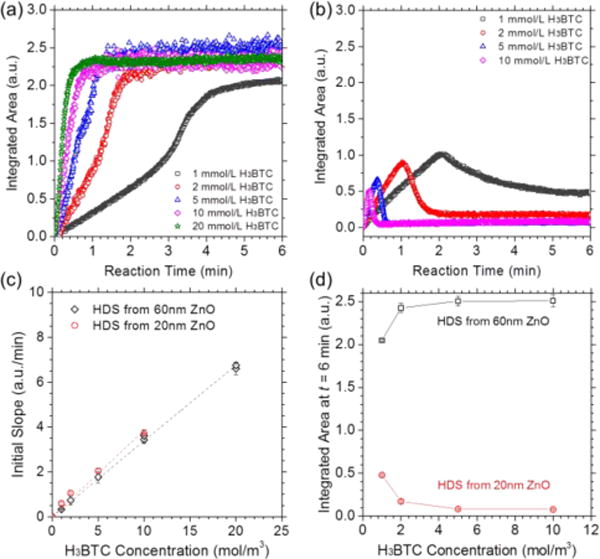
Figure 5.

(a–b) Integrated IR peak area for vas(OCO−) at ≈ 1647 cm−1 as a function of reaction time during the flow of H3BTC solutions on (Zn, Cu) HDSs converted from (a) ≈ 60 nm and (b) ≈ 20 nm of ALD ZnO thin films. (c) Initial slope (0 ≤ t ≤ 0.1 min) de-rived from the curves in (a–b) as a function of H3BTC concentration. The dashed line represents linear fitting. (d) Integrated IR peak area for vas(OCO−) at ≈ 1647 cm−1 at t = 6 min, representing the final amount of HKUST-1 synthesized from HDS thin films with and without a ZnO interfacial layer. Error bars in (c) and (d) represent standard deviation for each sample.
