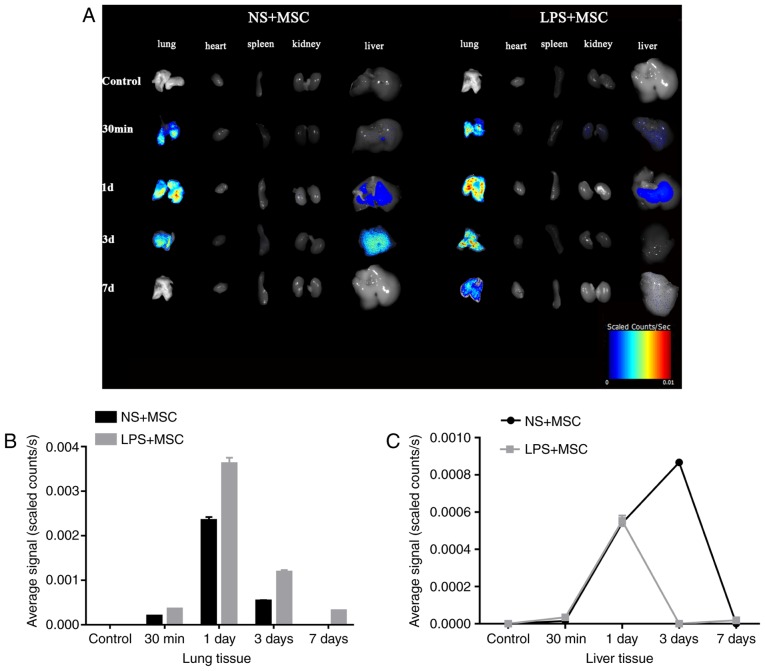
Figure 4.
Distribution of fluorescence in organs, and fluorescence intensity of lungs and liver at each time point. (A) Fluorescent images of organs of mice at 30 min, 1 day, 3 days and 7 days following labeled hUC-MSC transplantation. (B) Average fluorescent signal intensity in the lung was quantified between 30 min and 7 days. (C) Quantified fluorescent signal intensity in the liver between 30 min and 7 days. The results are presented as the mean ± standard deviation (n=3 per group). hUC-MSCs, human umbilical cord-derived mesenchymal stem cells; LPS, lipopolysaccharide; NS, normal saline; d, day.

