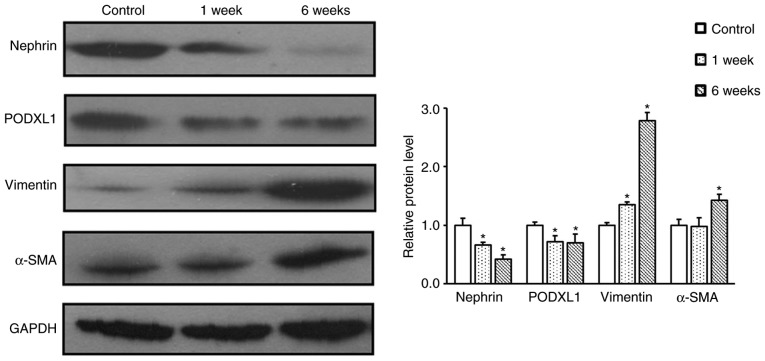
Figure 4.
Nephrin, PODXL1, vimentin and α-SMA protein expression levels in the podocytes of diabetic and control rats were examined with western blot analysis. All experiments were performed in triplicate, and the results are presented as the mean ± standard deviation. *P<0.05 vs. control group. PODXL1, podocalyxin-like 1; α-SMA, α-smooth muscle actin.

