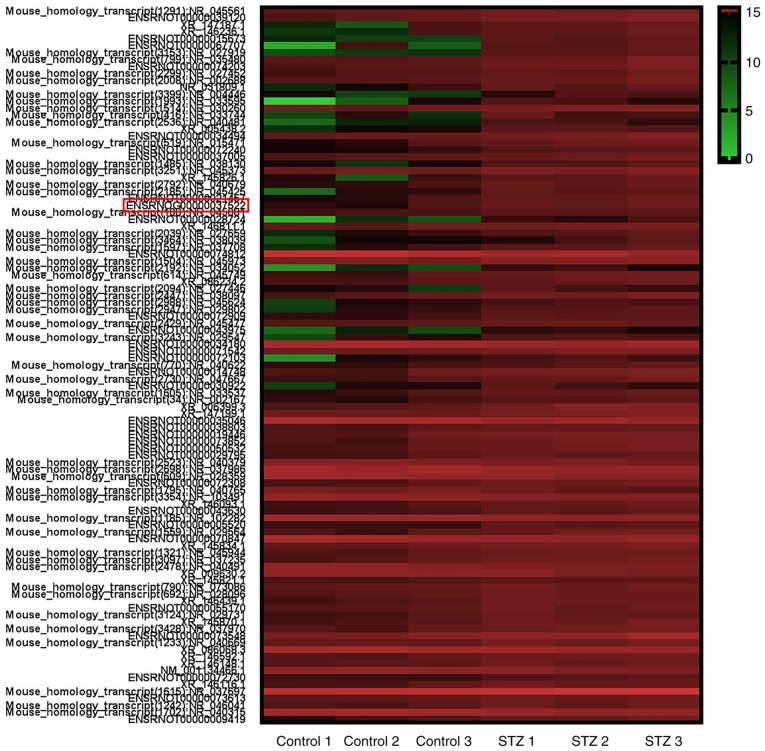
Figure 5.
Hierarchical clustering heat map revealing the distinct lncRNA expression profiles in the podocytes of the control and STZ-treated diabetic rats. After 6 weeks, the podocytes were obtained from control and STZ-treated diabetic rats and hierarchical clustering analysis was performed. The relative lncRNA expression is depicted according to the color scale. The red column indicates upregulation and the green column indicates downregulation. lncRNA, long noncoding RNA; STZ, streptozocin. Control 1, 2 and 3 indicated three representative podocytes samples from control rats; STZ 1, 2 and 3 indicated three representative podocytes samples from STZ-treated diabetic rats.

