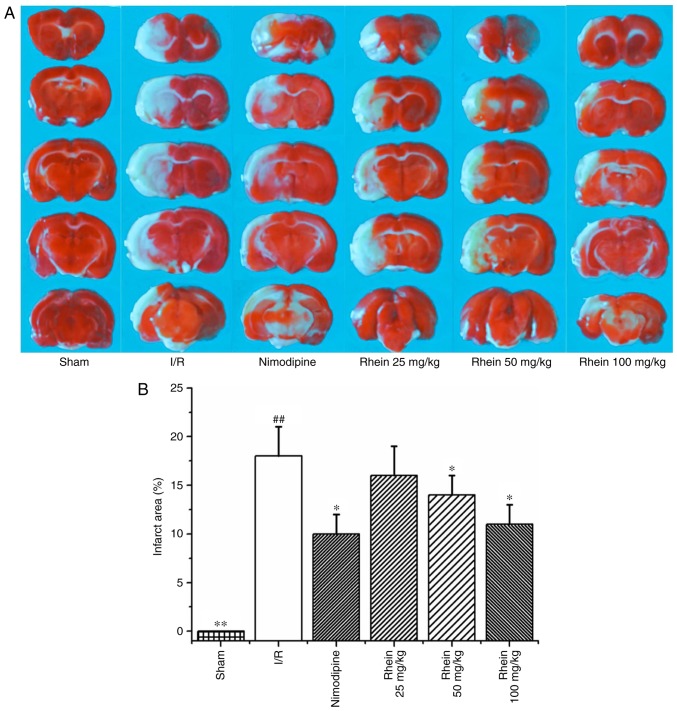
Figure 1.
Effect of rhein on the area of cerebral infarction in I/R rats. (A) TTC staining. (B) Quantification of TTC staining results. Values are presented as the mean ± standard deviation. n=6/group. ##P<0.01 vs. the sham group; *P<0.05 and **P<0.01 vs. the I/R group. I/R, ischemic/reperfusion; TTC, 2,3,5-triphenyltetrazolium chloride.

