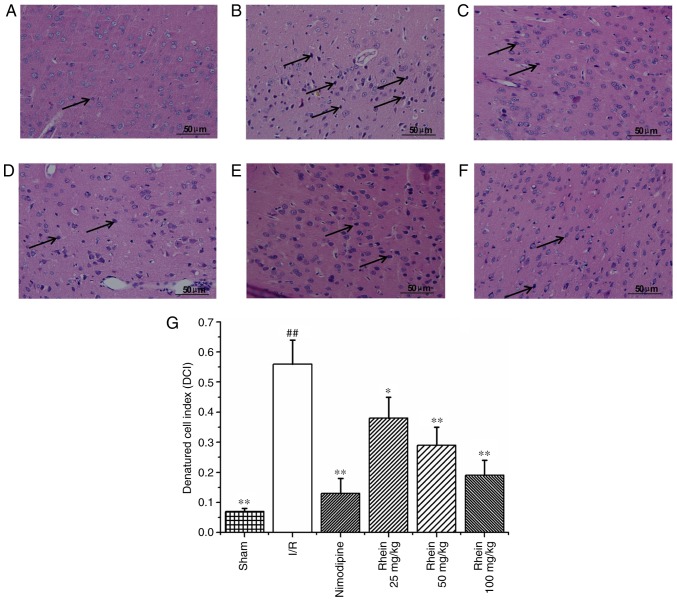
Figure 2.
Effect of rhein on nerve cell morphology and structure in the cortices of I/R rats. Hematoxylin and eosin staining in the (A) sham, (B) I/R, (C) nimodipine, (D) 25, (E) 50 and (F) 100 mg/kg rhein treatment groups. Arrows indicate denatured cells. Magnification, ×400. (G) The denatured cell index for all groups. ##P<0.01 vs. the sham group; *P<0.05 and **P<0.01 vs. the I/R group. I/R, ischemic/reperfusion.

