Figure 3.
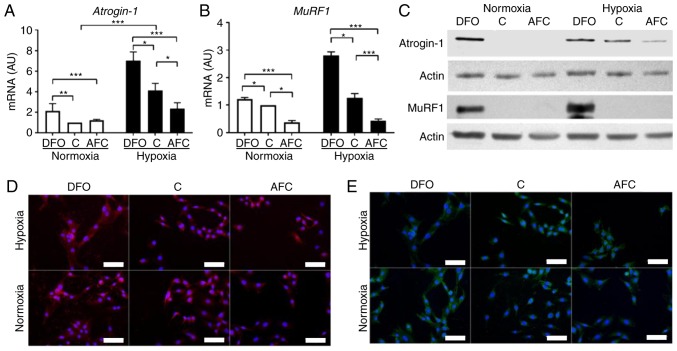
Expression of atrophy markers in L6G8C5 cells with concomitant optimal, reduced or increased iron availability in normoxia and hypoxia. mRNA expression levels of (A) atrogin-1 and (B) MuRF1 in L6G8C5 cells. (C) Western blot analysis of respective proteins expression in the cell lysates. Representative images of immunocytochemical staining of (D) atrogin-1 and (E) MuRF1 in L6G8C5 cell lines (with DAPI as a nuclei maker). Scalebar length, 25 µm. Data are presented as the mean + standard deviation obtained from three separate experiments. *P<0.05; **P<0.01; ***P<0.001. AU, arbitrary units; MuRF1, muscle-specific RING-finger 1; DFO, reduced iron concentration via deferroxamine; C, control; AFC, increased iron concentration via ammonium ferric citrate.

