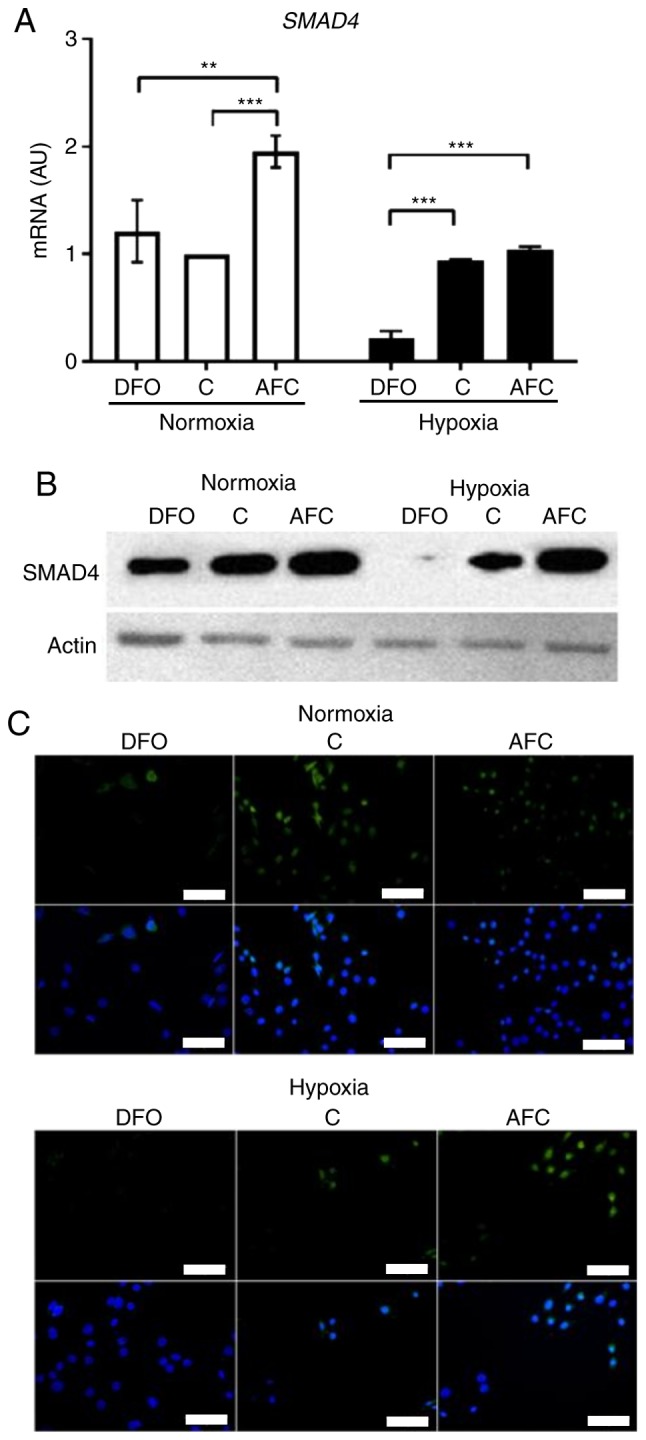
Figure 4.

Expression of SMAD4 in L6G8C5 cells with concomitant optimal, reduced or increased iron availability in normoxia and hypoxia. (A) mRNA expression levels of SMAD4 in L6G8C5 cells. (B) Western blot analysis of respective proteins expression in the cell lysates. (C) Representative images of immunocytochemical staining of SMAD4 and DAPI as a nuclei marker in L6G8C5 cell lines. Scalebar length, 25 µm. Data are presented as the mean + standard deviation obtained from three separate experiments. **P<0.01; ***P<0.001. AU, arbitrary units; DFO, reduced iron concentration via deferroxamine; C, control; AFC, increased iron concentration via ammonium ferric citrate; SMAD4, mothers against decapentaplegic homolog 4.
