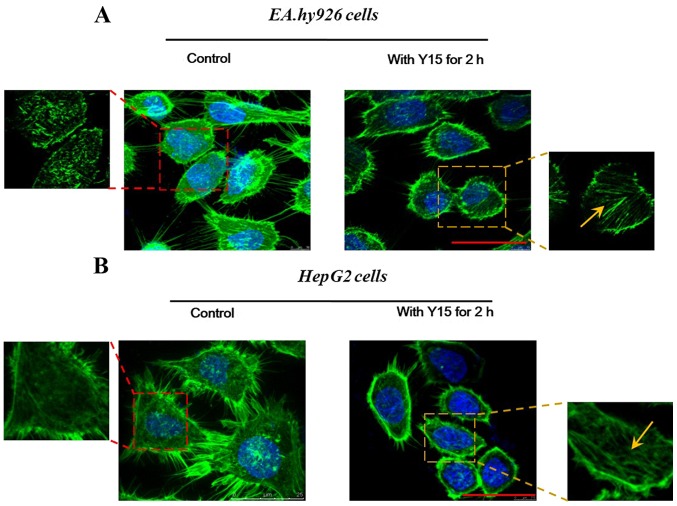
Figure 3.
Effect of treatment with 50 µM focal adhesion kinase (FAK) inhibitor (Y15) on the distribution of F-actin in Ea.hy926 and HepG2 cells. Confocal immunofluorescence images of (A) EA.hy926 and (B) HepG2 cells, showing changes in the localization of F-actin (green, F-actin; blue, nucleus) in response to 50 µM Y15 for 2 h; scale bar, 20 µm. The designated region indicated by the red square frames was enlarged to show the detailed fiber structure in the cell body. Inhibition of FAK induced retraction of filopodia and lamellipodia in the cell protrusions, resulting in formation of stress fiber structures (yellow arrows) in the cell bodies.

