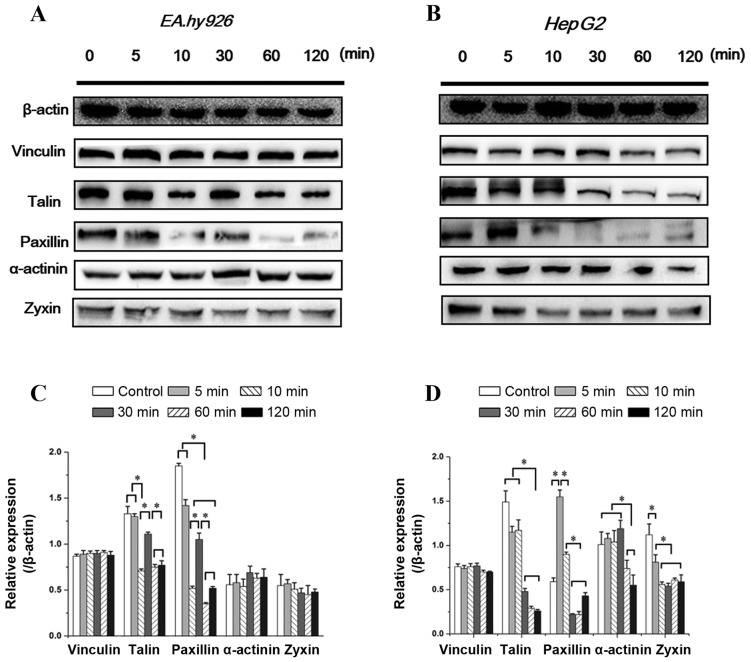
Figure 6.
Effect of Y15 on the expression level of focal adhesion (FA) components in two cell lines within 2 h. Expression level of vinculin, talin, paxillin, α-actinin and zyxin within 2 h in (A) endothelial cells and (B) hepatoblastoma cells with inhibition of FAK. (C and D) Quantification of each protein expression level by image analysis of the western blot bands in (A and B). The expression level of β-actin in each group was used as an internal control, and the relative expression levels were calculated. Data are presented as means ± standard error of the mean from three independent experiments. *P<0.05 denotes statistically significant differences.

