Figure 3.
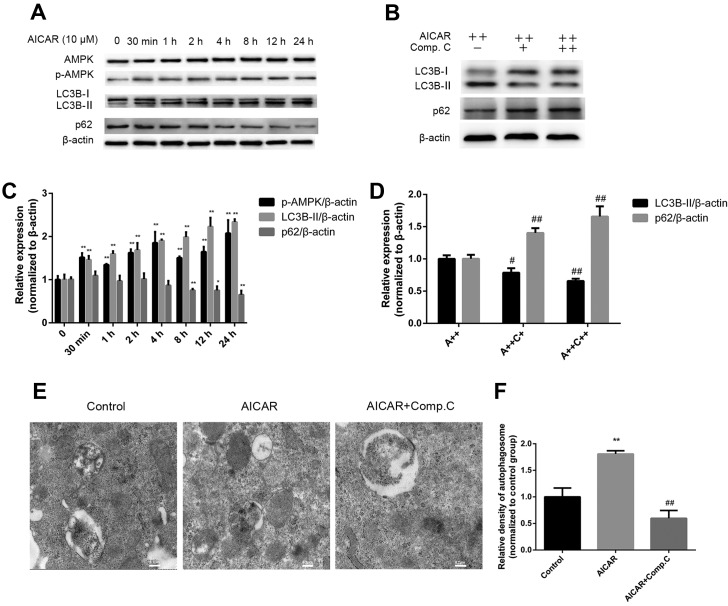
AMPK activation induces autophagy. (A) Cells were treated with AICAR and (B) AICAR (A++, 10 μM) + compound C (C++, 1 μM) for 24 h, after which western blot analysis was performed. (C and D) Semi-quantitative analysis of western blotting was conducted using ImageJ software and density values were normalized to β-actin, with the control group set as 1. (E) Cells were treated with AICAR (10 μM) or AICAR (10 μM) + compound C (1 μM) for 24 h. Representative images of autophagosomes were captured by transmission electron microscopy (scale bar, 0.2 μm). (F) Relative quantification of autophagosome density; values of the control group were set as 1. *P<0.05, **P<0.01 compared with the control group; #P<0.05, ##P<0.01 compared with the AICAR(A++) group. AICAR, 5-aminoimdazole-4-carboxamide-1-β-D-ribofuranoside; AMPK, adenosine monophosphate-activated protein kinase; LC3B, microtubule-associated proteins 1A/1B light chain 3B; p-AMPK, phosphorylated-AMPK.

