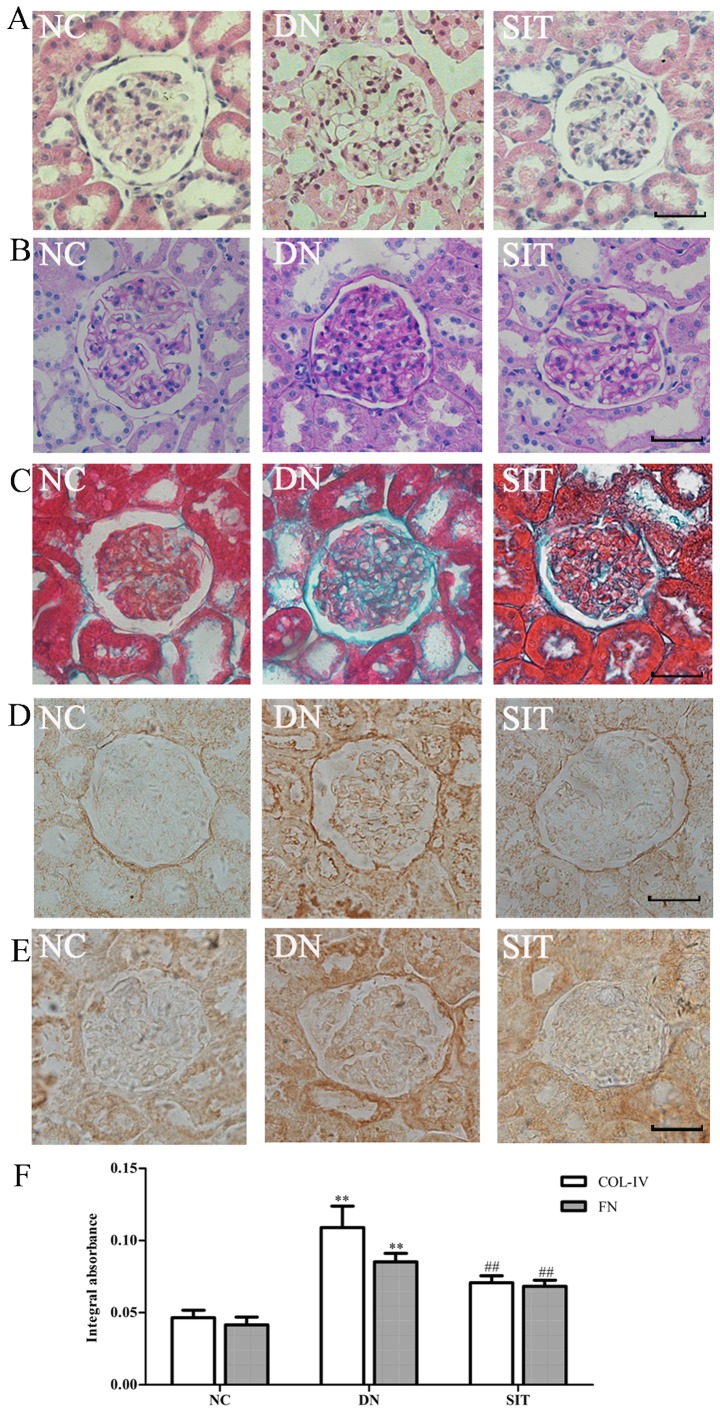
Figure 2.
Renal histology and immunohistochemistry. (A) H&E stained kidney sections of the normal control, diabetic nephropathy group, and diabetic nephropathy treated with sitagliptin (SIT). (B) Periodic acid-Schiff (PAS) staining was performed in the kidneys of the different groups. (C) Masson staining was performed in the kidneys of the different groups. (D) COLIV immunohistochemistry staining in the kidneys of the different groups. (E) FN immunohisto-chemistry staining in the kidneys of the different groups. (F) Integral absorbance of immunohistochemistry staining. NC, negative control group; DN, diabetic nephropathy group; SIT, administration of SIT at dose of 10 mg/kg. n=3. Bars, 50 µm. **P<0.01 vs. NC group; ##P<0.01 vs. DN group.

