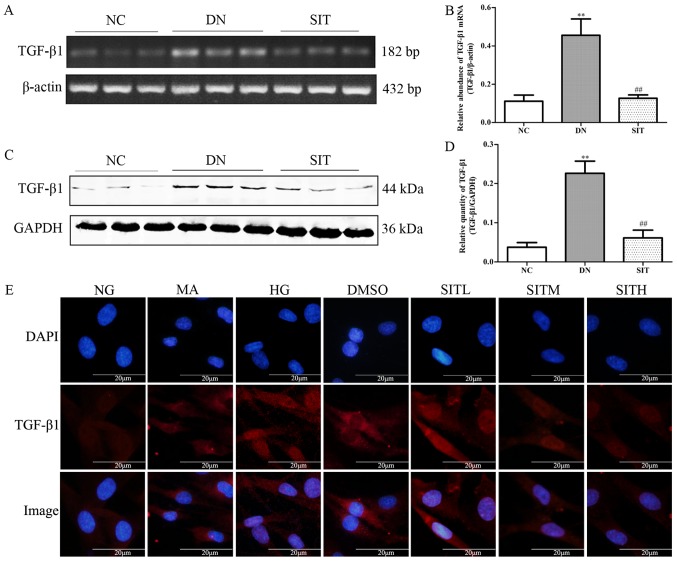
Figure 3.
Effects of sitagliptin (SIT) on transforming growth factor-β1 (TGF-β1) expression in vivo and in vitro. (A) RT-PCR bands of TGF-β1 mRNA in DN rats. (B) Relative abundance of TGF-β1 mRNA in DN rats. (C) Western blot bands of TGF-β1 in DN rats. (D) Relative abundance of TGF-β1 in DN rats. (E) Expression of TGF-β1 in mesangial cells induced by high glucose through immunofluorescence. NC, negative control group; DN, diabetic nephropathy group; SIT, administration of SIT at dose of 10 mg/kg; NG, cells treated with normal glucose 5.56 mmol/l; MA, cells treated with normal glucose 5.56 mmol/l + mannitol 24.44 mmol/l; HG, cells treated with high glucose 30 mmol/l; dimethyl sulfoxide (DMSO), cells treated with high glucose + 1‰ DMSO; SITL, SITM, SITH, cells treated with high glucose + 0.1, 1 and 10 µmol/ml sitagliptin, respectively. Data are expressed as mean ± SE. n=3. **P<0.01 vs. NC group; ##P<0.01 vs. DN group.

