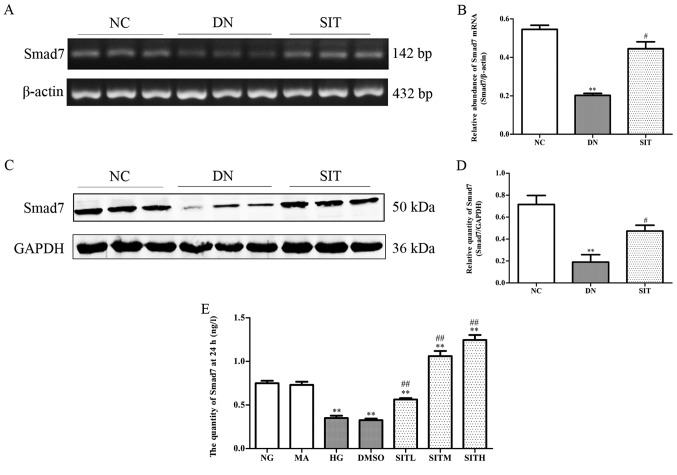
Figure 5.
Effects of sitagliptin (SIT) on Smad7 expression in vivo and in vitro. (A) RT-PCR bands of Smad7 mRNA in DN rats. (B) Relative abundance of Smad7 mRNA in DN rats. (C) Western blot bands of Smad7 in DN rats. (D) Relative abundance of Smad7 in DN rats. (E) Expression of Smad7 in mesangial cells induced by high glucose through enzyme-linked immunosorbent assay (ELISA). NC, negative control group; DN, diabetic nephropathy group; SIT, administration of SIT at dose of 10 mg/kg; NG, cells treated with normal glucose 5.56 mmol/l; MA, cells treated with normal glucose 5.56 mmol/l + mannitol 24.44 mmol/l; HG, cells treated with high glucose 30 mmol/l; dimethyl sulfoxide (DMSO), cells treated with high glucose + 1‰ DMSO; SITL, SITM, SITH, cells treated with high glucose + 0.1, 1 and 10 µmol/ml sitagliptin, respectively. Data are expressed as mean ± SE. n=3. **P<0.01 vs. NC group; #P<0.05 vs. DN group; ##P<0.01 vs. DN group.

