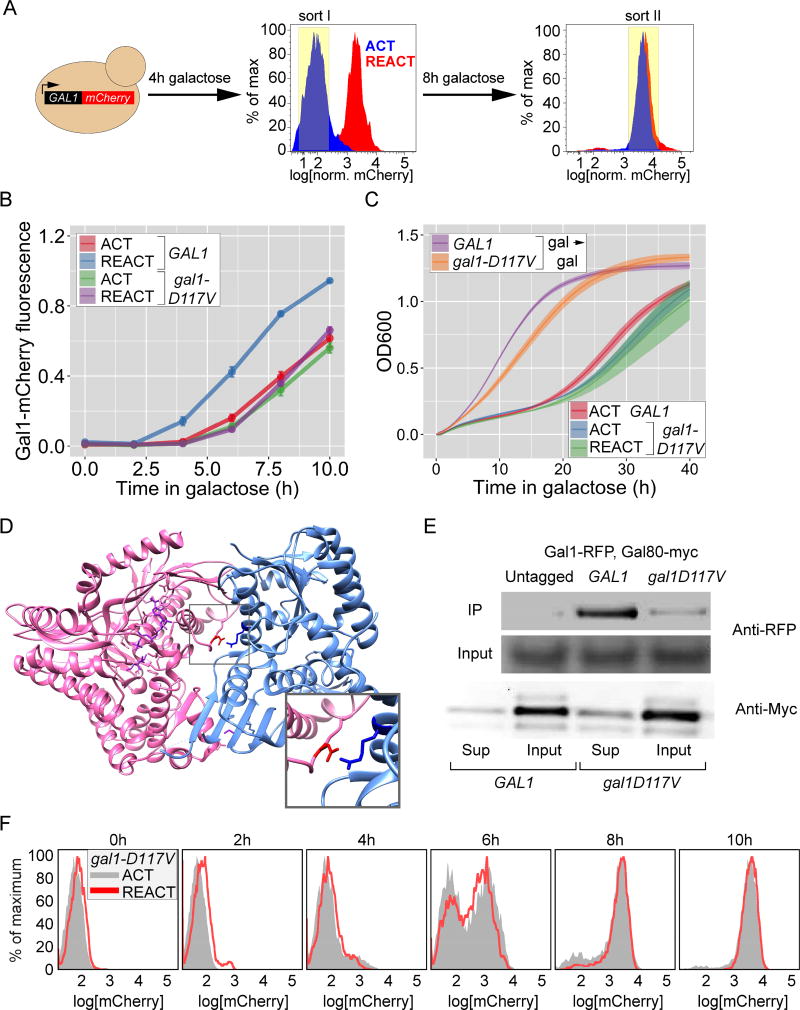
Figure 2. Genetic screen for mutants defective for GAL memory identifies gal1-D117V.
A. Schematic of the 2-step FACS based screen (see Methods for details). B. Gal1-mCherry intensity relative to CFP internal control in wild-type and gal1-D117V mutant, measured by flow-cytometry. Cells were shifted from glucose to galactose for activation (ACT) or grown in galactose overnight, shifted to glucose for 12 hours and then shifted to galactose for reactivation (REACT). Error bar represents SEM from ≥ 4 biological replicates. C. Growth of wild-type and gal1-D117V mutant cells assayed by measuring OD600 every 20 minutes during continuous growth in galactose (gal → gal), during activation (ACT) or reactivation (REACT) after 12hours of repression. The line represents the mean and the envelope represent the SEM from ≥ 4 biological replicates. D. Co-crystal structure between Gal3 (pink) and Gal80 (blue), highlighting the salt bridge between the Gal3-Asp111 and Gal80-Arg367 (inset). E. Lysates from strains expressing Gal80-13xmyc and Gal1-mCherry were subjected to co-immunoprecipitation using anti-myc antibody. The immunoprecipitated fractions (IP; top), the input fractions (middle) and the supernatant fraction after immunodepletion (bottom) were resolved by SDS PAGE and immunoblotted against either mCherry (top two panels) or the myc epitope tag (bottom panels). F. Overlay of histograms for ACT and REACT of gal1D117V in B. The yeast strains and the number of biological replicates for all experiments are listed in Table S1 and S2, respectively. Additional characterization of gal1-D117V mutant, Figure S1.

