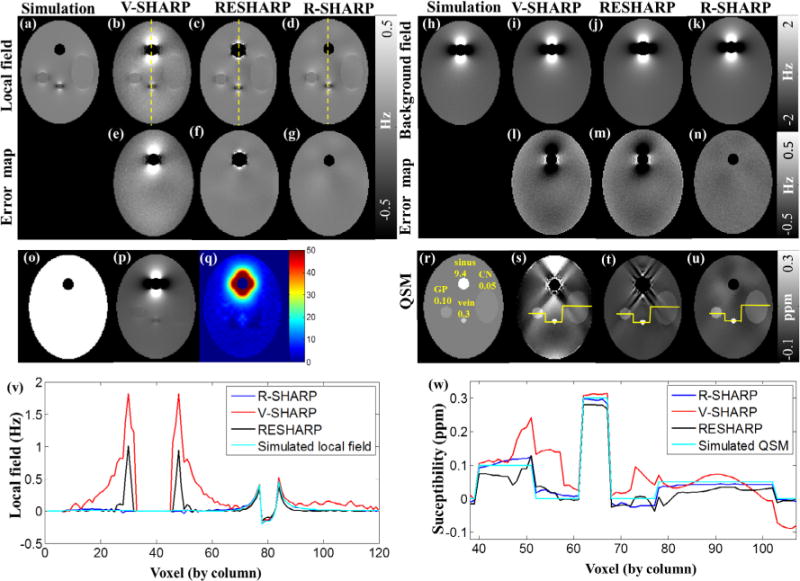
Fig. 2.

Numerical simulations. (a–g) Local fields of the simulation target input, V-SHARP, RESHARP and R-SHARP and their error maps, (h–n) background fields of the simulation target input, V-SHARP, RESHARP and R-SHARP and their error maps, (o) simulated binary mask, (q) level set function of phase image (p), which is the summation of (a) and (h), (r–u) QSMs derived from the simulated local field (r), V-SHARP(s), RESHARP (t) and R-SHARP (u), (v) local field profiles of the dashed yellow lines in (b–d), (w) susceptibility profiles of the yellow lines in (s–u). (For interpretation of the references to color in this figure legend, the reader is referred to the web version of this article.)
