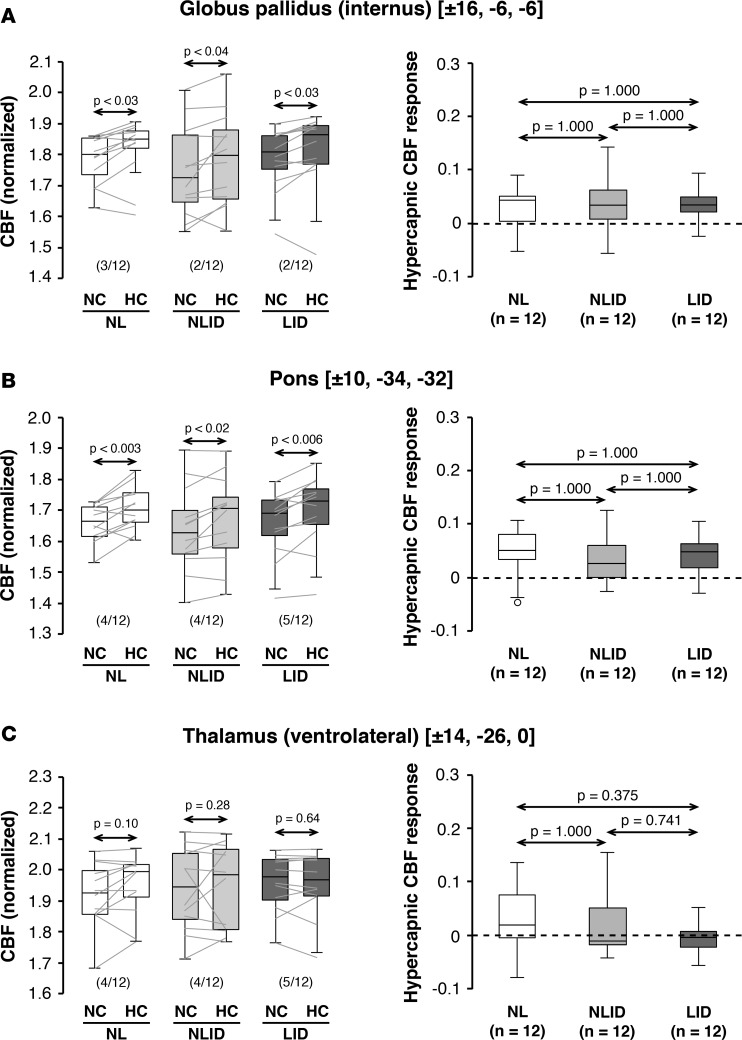
Figure 2. Hypercapnic cerebral blood flow responses in other levodopa dissociation regions.
Globally normalized cerebral blood flow (CBF) values were measured in the other levodopa dissociation regions (LDDRs) reported previously in the (A) internal globus pallidus, (B) pons, and (C) ventrolateral thalamus of the levodopa-induced dyskinesia (LID; n = 12), non-LID (NLID; n = 12), and normal control (NL; n = 12) groups (see Results). Left: Significant CBF increases with hypercapnia were seen in the pallidal and pontine LDDRs but not in the ventrolateral thalamic dissociation region. Horizontal arrows denote significance levels (P values) for each group according to the paired Student’s t test. Right: In contrast to the putamen (Figure 1), significant group differences were not observed for hypercapnic CBF responses measured in the other dissociation regions. Horizontal arrows denote significance levels (P values) for group comparisons according to the post-hoc Bonferroni test of 1-way ANOVA. (Graphical displays as in Figure 1.)

