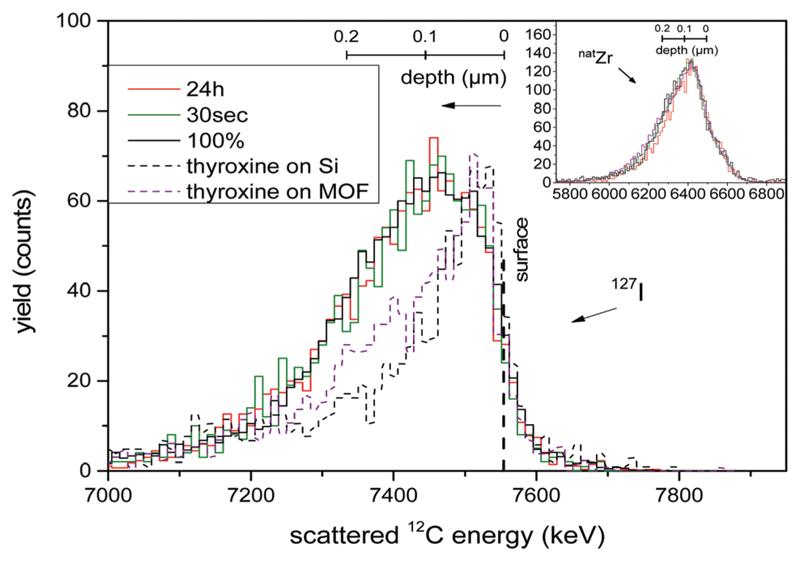
Fig. 2.
Normalized RBS signal of the iodine content and normalized RBS zirconium signal (inset). The vertical dashed line marks the surface of the sample, while the lower energies correspond to the depth of the sample with the corresponding depth scales depicted. The solid lines correspond to UiO-66@Si samples that have been exposed to PSE for times as indicated, 100% is the (UiO-66–(I-bdc)@Si) sample, and the dotted lines correspond to reference samples with thyroxine.

