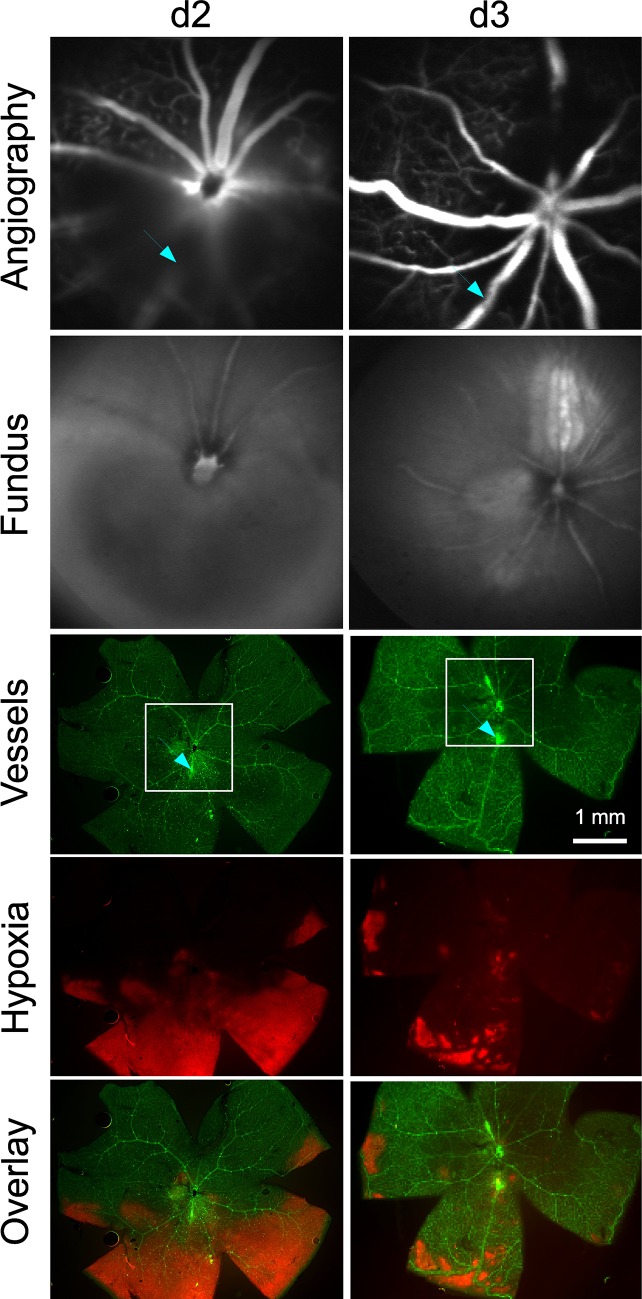
Fig 1. RVO and hypoxic area.
In a preliminary experiment, two veins were occluded in two mice at d0. Fluorescein angiography by SLO showed the occlusion of the veins, and fundus images taken by SLO are shown for comparison. Retinal flatmounts were stained for vessels with lectin (green) and with hypoxyprobe (red) for hypoxic areas. The squares show the positions of the SLO images while the arrows show the position of laser sites. In one mouse at d2, the vein to the left was re-opened while the lower vein was still closed (arrow) and surrounded by a hypoxic area. In the other mouse at d3, the lower vein was re-opened (arrow) but showed some remnants of the hypoxic area. Typical results from a study of 5 mice are shown.

