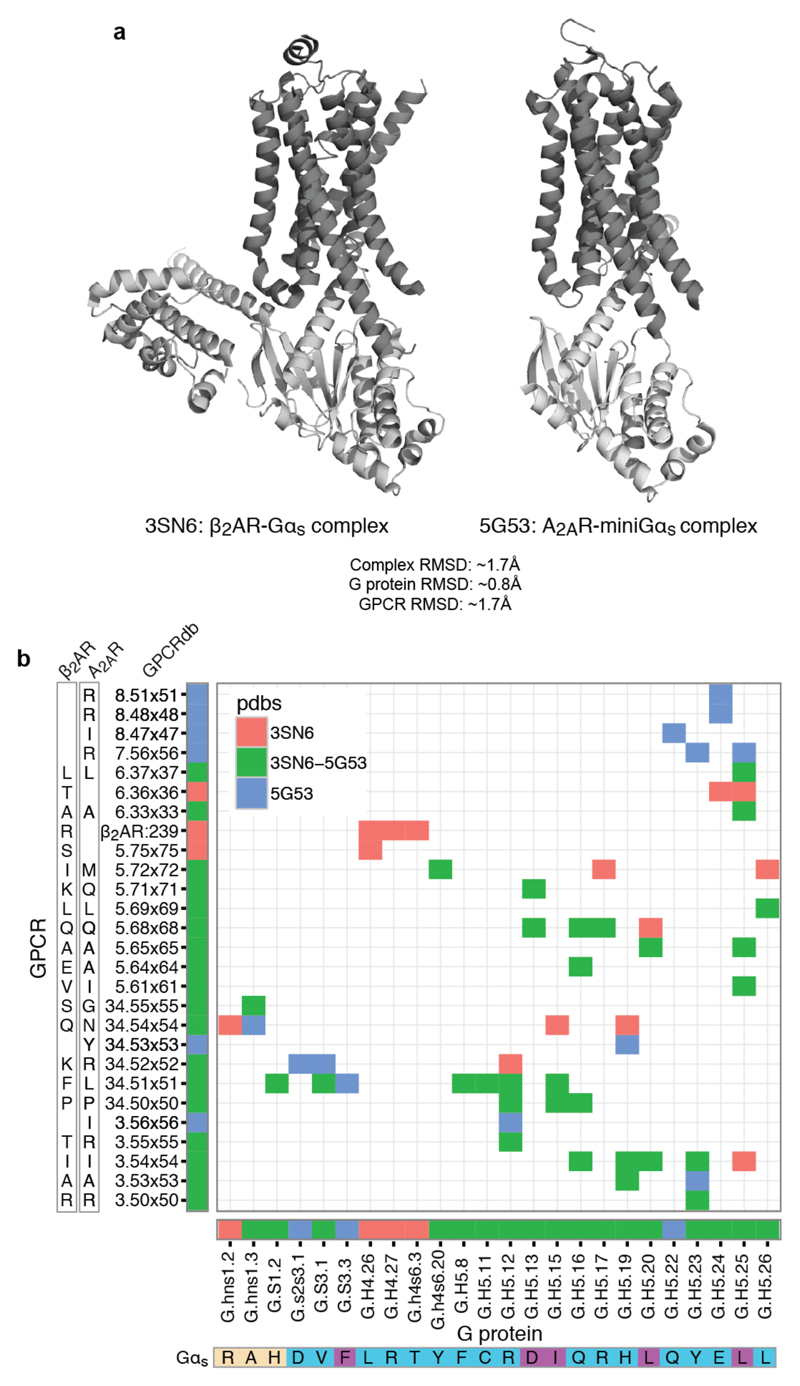
Extended Data Figure 7. Comparison of the interface contacts and the contacting residues between β2AR-Gs and A2AR-mini Gs.
a, Comparison of the overall structure of both complex structures shows that the two receptors bind the G protein in a similar binding mode. RMSD values are provided in the figure. b, Detailed comparison of the residue contacts between equivalent positions of β2AR and A2AR receptor with equivalent positions of Gs and the mini-Gs construct used to obtain the complex structures. The exact residue and the GPCRdb numbering scheme for the receptor and the CGN system for the G protein are shown on the axes. Contacts (coloured cells in the matrix) and positions (horizontal and vertical coloured bars next to the axes) that are common or unique to the β2AR or A2AR Gs complex are shown in different colours. The G protein selectivity barcode as in Fig. 3 is shown in the bottom of the matrix. This analysis suggests that while the same positions of the G protein and GPCRs may be involved in the recognition, distinct residues (both positions and the amino acid residue) on the two different receptors contact them. In other words, the same selectivity barcode presented by Gαs is read differently by receptors belonging to different sub-types.

